Logging with Grafana

Amash is a recent B-Tech CSE graduate from Birla Institute of Applied Sciences. Having an interest in learning new technologies is one of his greatest assets.
Trying to be a part of global communities 🌍 Opportunity seeker. Open source contributor. 🔓
In this article, discover how to create awesome, custom dashboards to watch over your system, Docker, and Nginx logs with Grafana. If you're new to Grafana and want to learn more about it, check out our beginner's guide by clicking here.
Before you begin
Make sure you have an AWS account ready and understand how to set up AWS EC2. If you're new to AWS EC2, click here to learn more.
Having a good grasp of Docker basics is important for this blog, as we'll be using Docker commands frequently. If you want to learn more about Docker, click here.
Execution Snapshot
Here's our plan: First, we'll set up Grafana on our server (I'm using AWS EC2 for this blog) by running a few commands. Then, we'll get Loki set up, followed by installing Promtail on the server. For Loki and Promtail, we'll use config files to save and get data. These config files are available for download from a URL. Loki acts as a data storage for logs and sends them to Grafana. Promtail collects logs from the source, like the system, and sends them to Loki, which then shares them with Grafana. Once we've downloaded the configs, we'll run Loki and Promtail using their docker containers.
Don't worry about the specific commands or configurations for now—just get a sense of what we're doing and how we're doing it. We'll dive into more details later on.

Setting up EC2
Start an AWS EC2 instance to use Grafana. Choose a 't2.micro' instance, which is free and won't cost you anything.
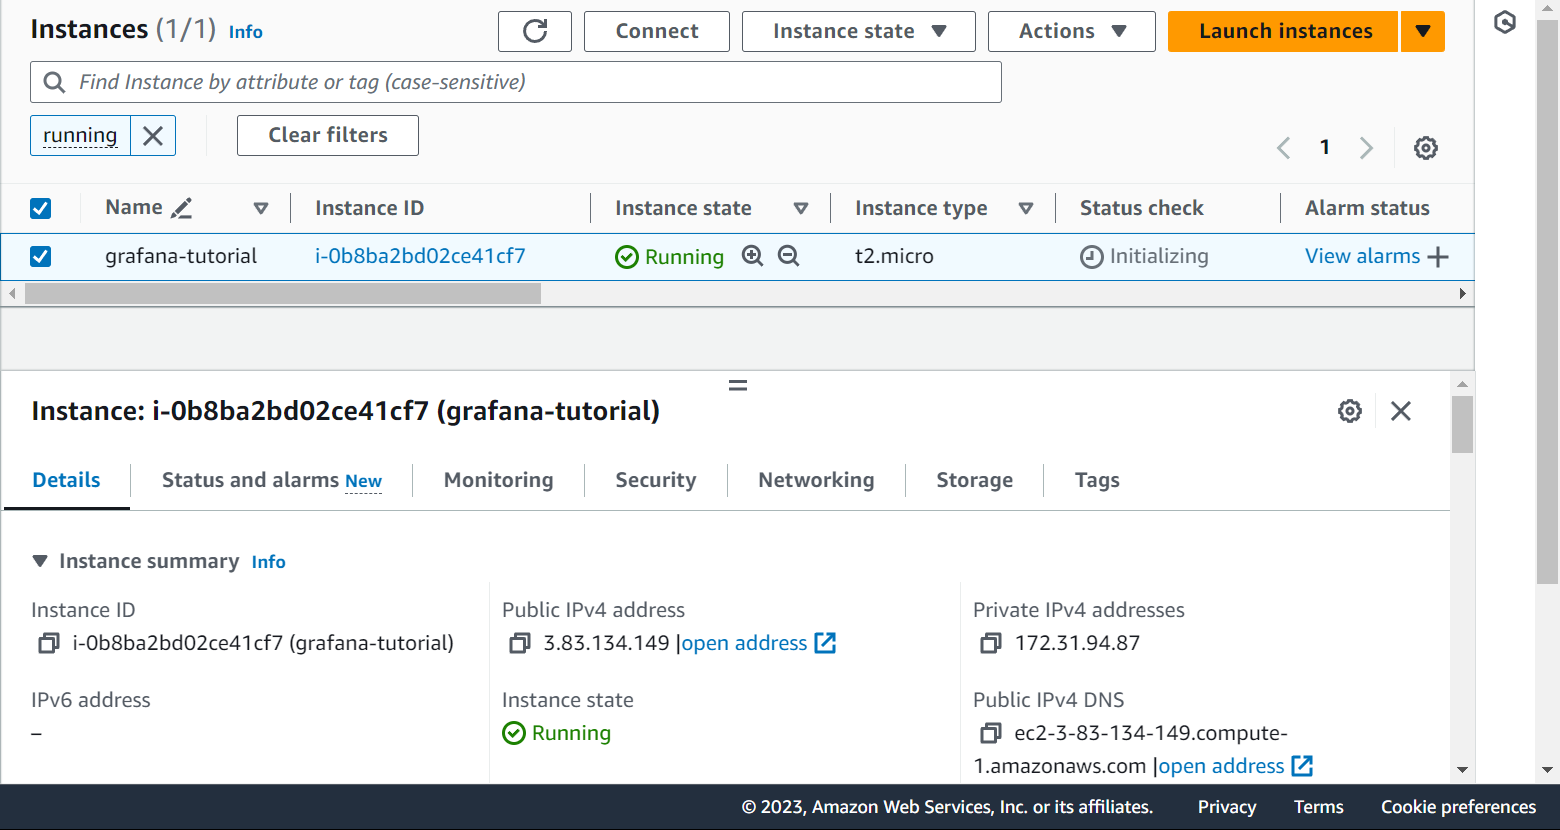
Connect to the instance and let's move on to installing Grafana on this EC2.
Getting Grafana
Before we proceed, click here to access a cheat sheet with all the commands we'll use to install Grafana, Loki, and Promtail in this blog.
First, update the system using
sudo apt updateand follow the commands from the cheatsheet to install Grafana.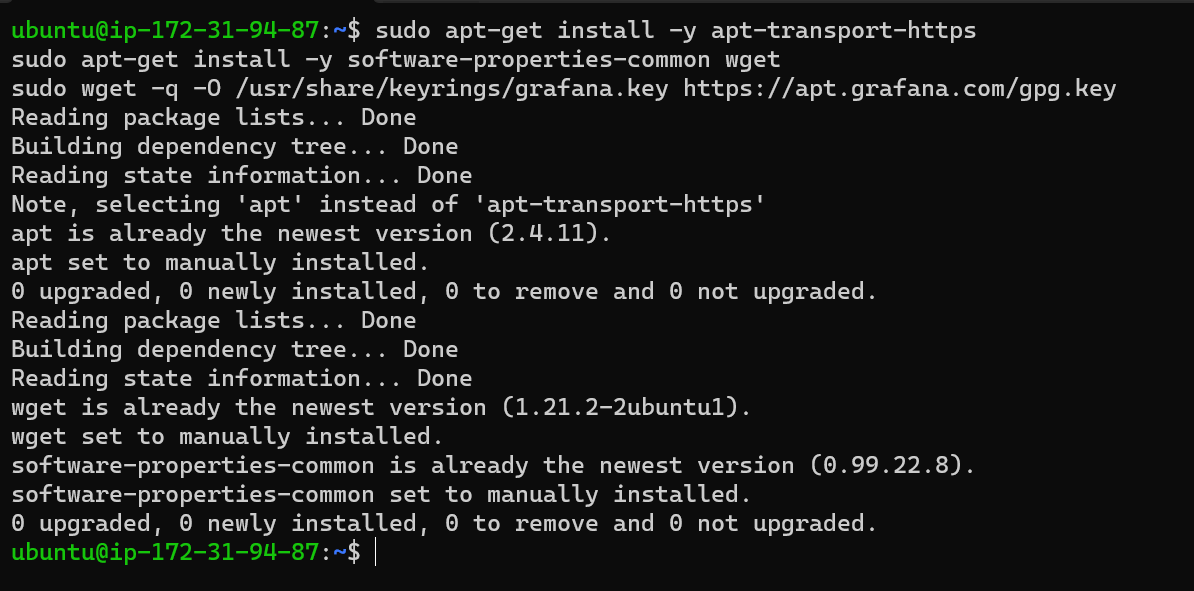
Choose the stable release for long-term support and simply copy and run the provided commands.

Next, update the system and proceed with the Grafana installation.
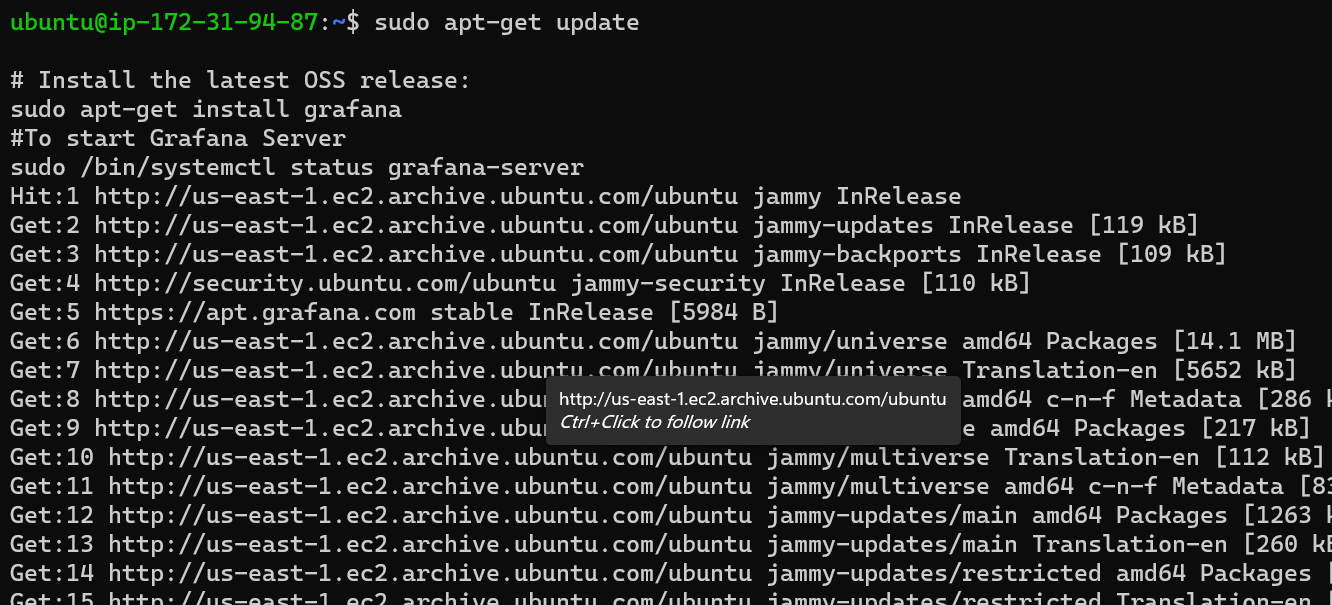
After installing, use the required commands to start and enable the Grafana service. Check if Grafana has started properly.
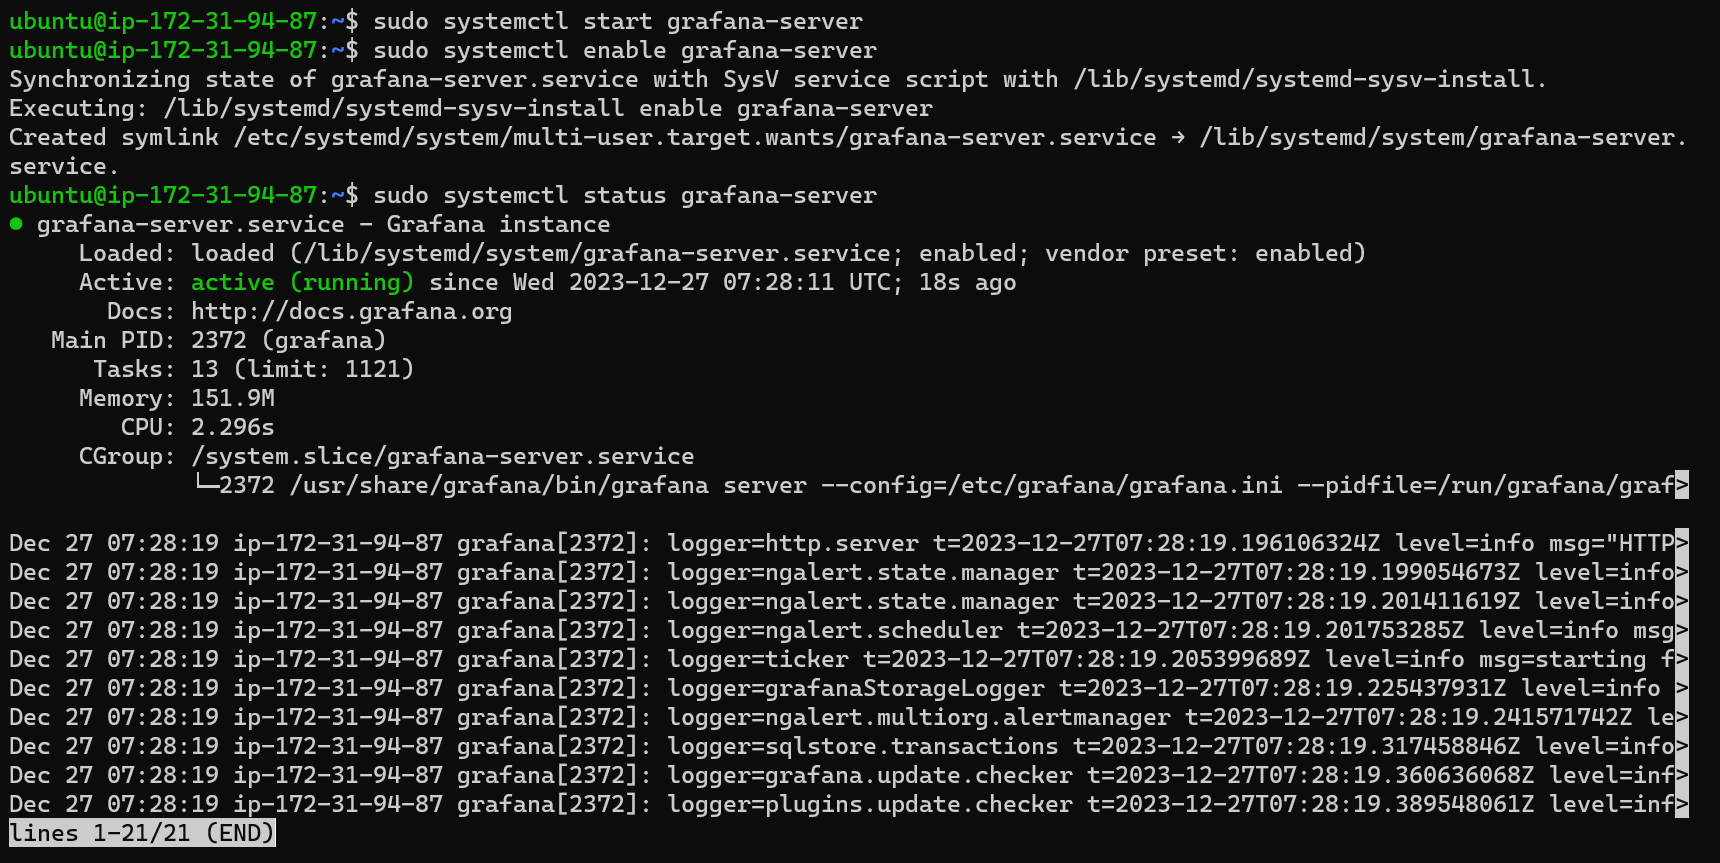
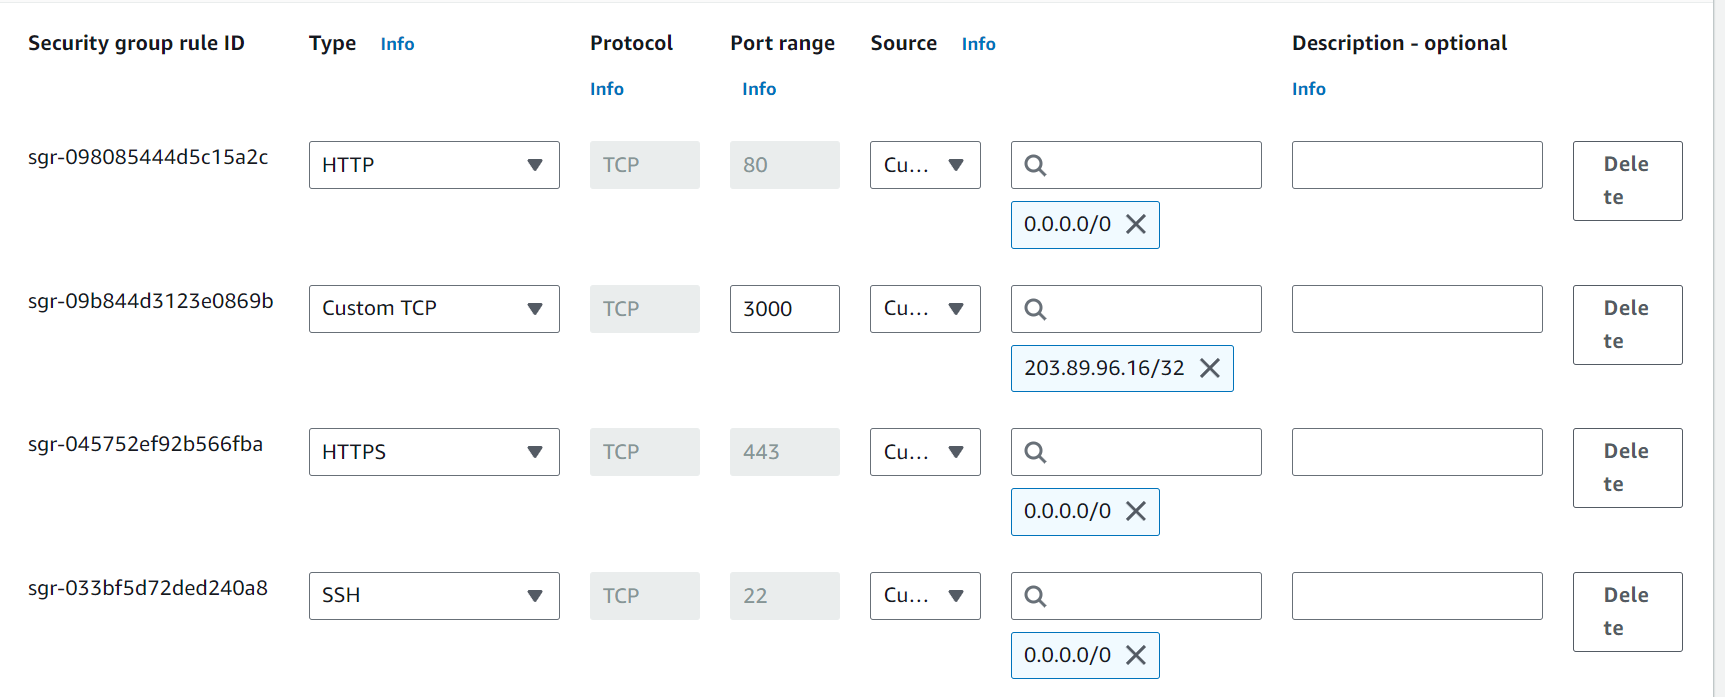
To access Grafana through the browser, open port 3000 in the inbound rules from the security group settings.
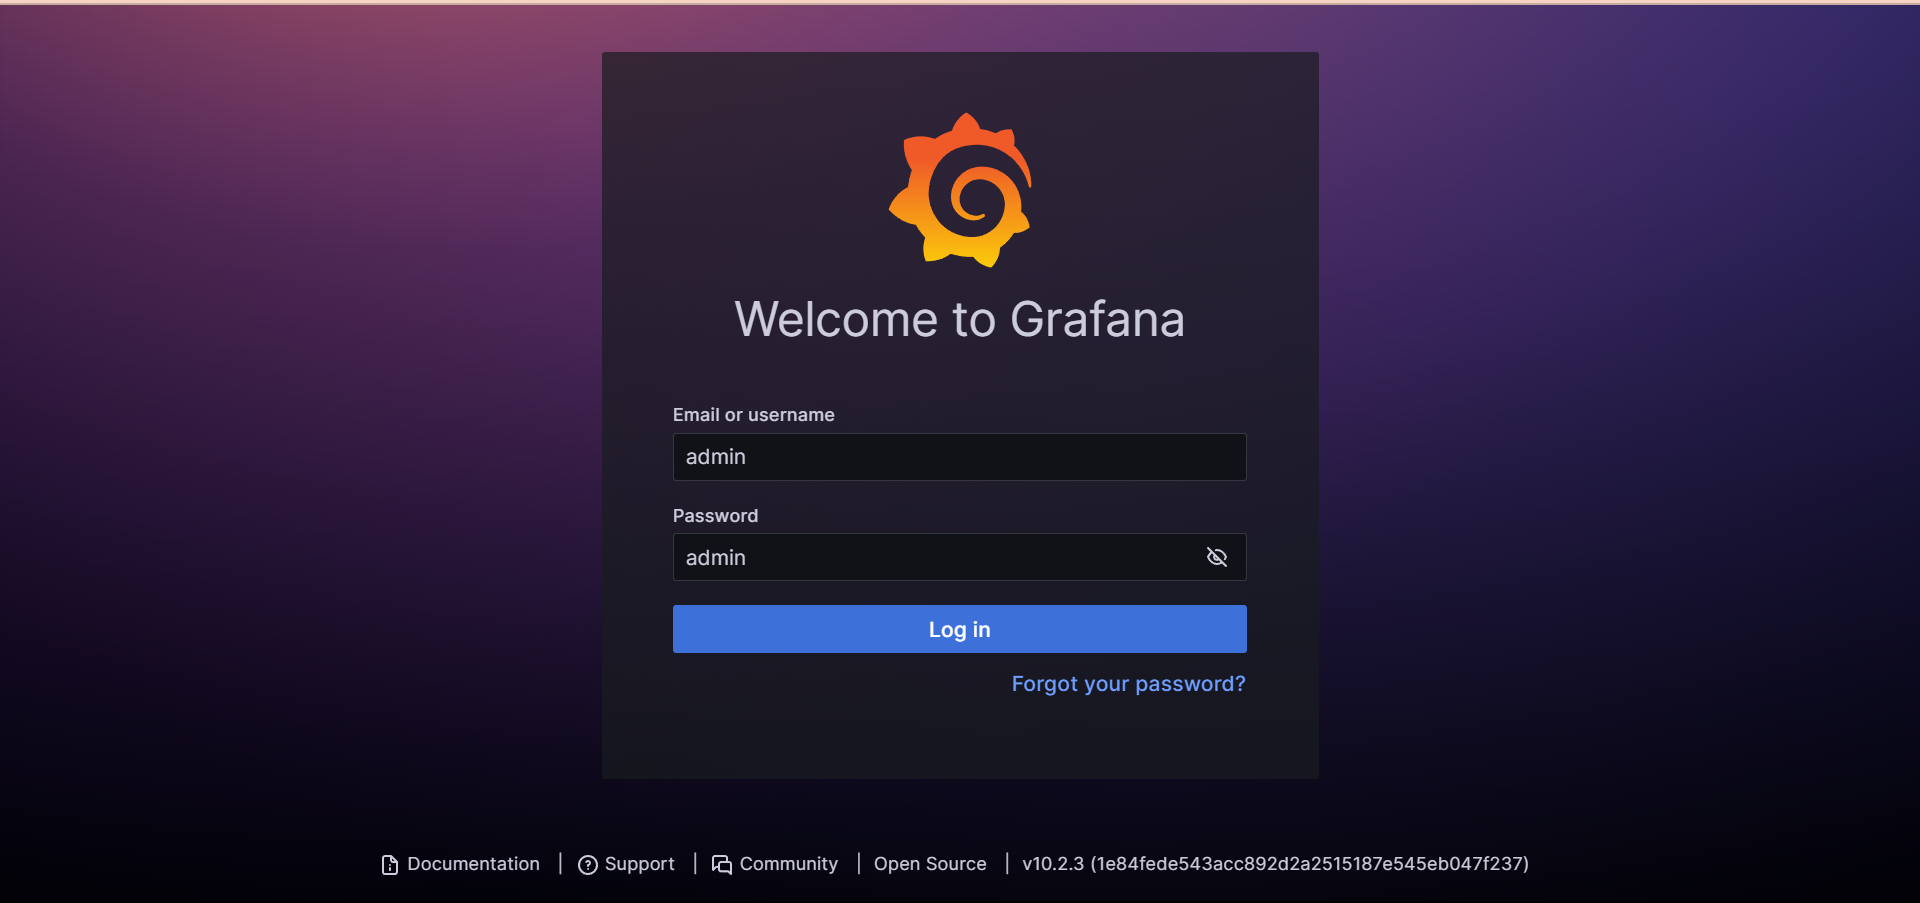
Initially, Grafana uses 'admin' as both the username and password. Later, you can create your own username and password.
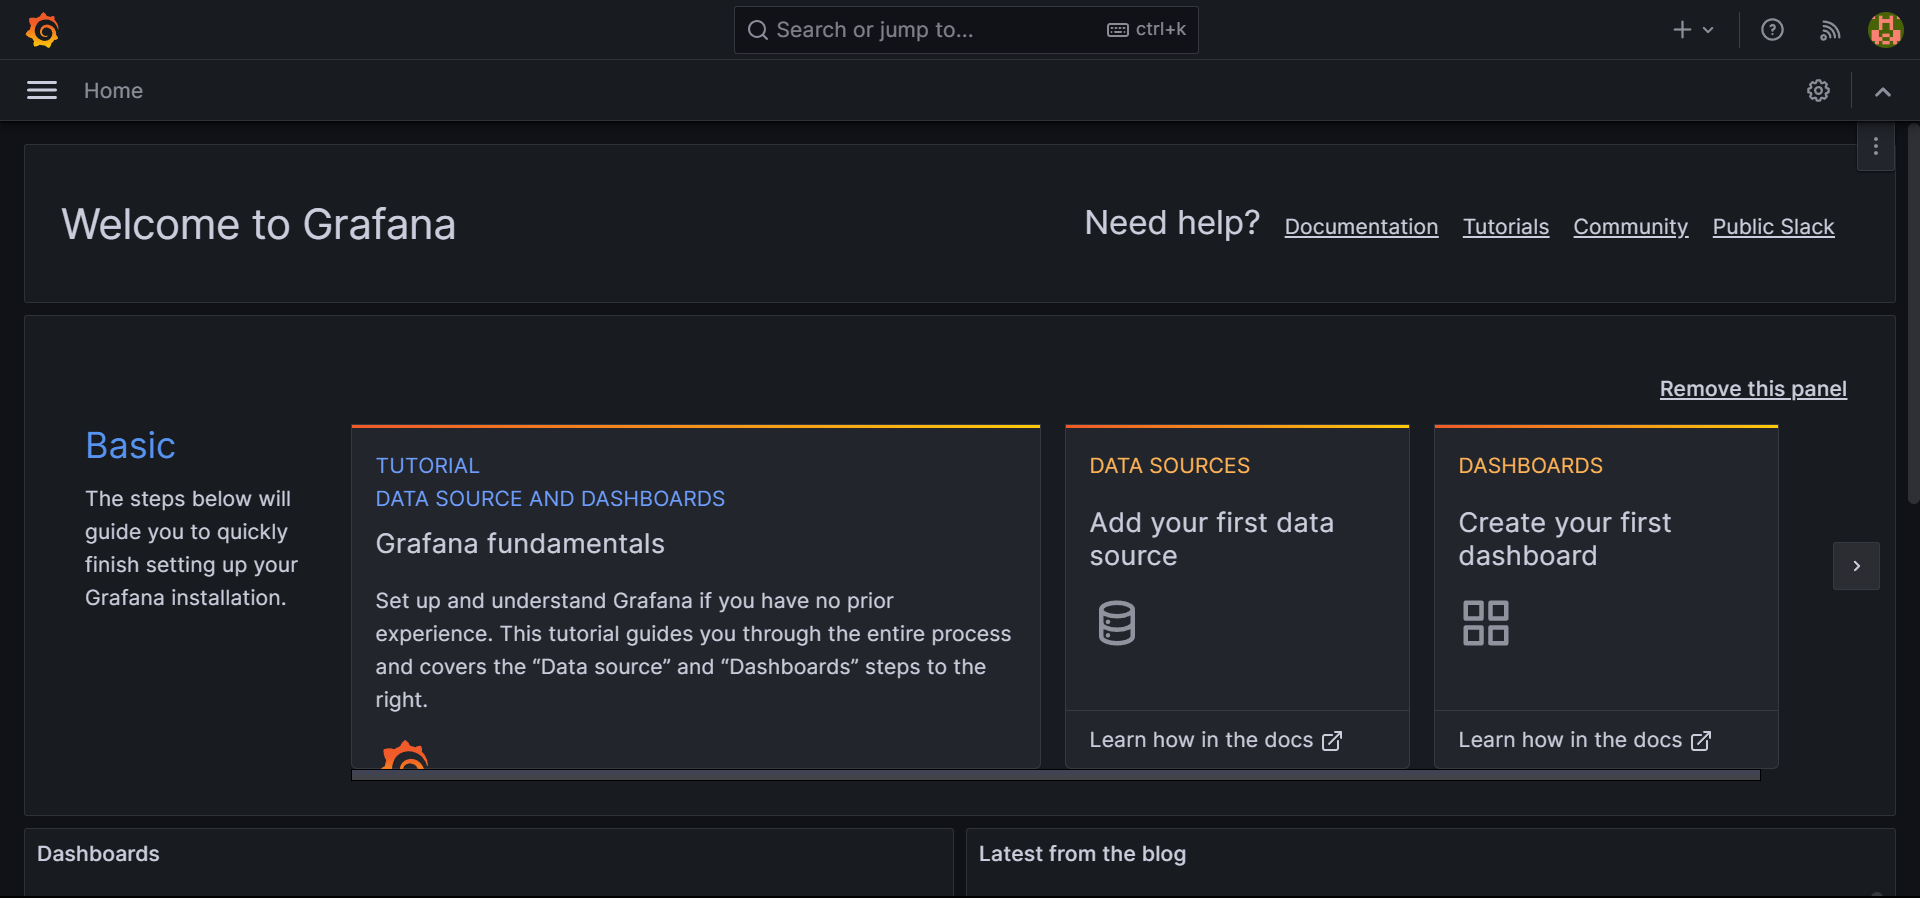
Congratulations, Grafana is now successfully accessible on the browser.
Next step: Let's set up Loki and Promtail to store and collect logs from various sources.
Installing Loki and Promtail using Docker
Before diving into Loki and Promtail, ensure you've installed Docker on your system to run Docker containers. If you're unsure how to install Docker on AWS EC2, follow these commands.
sudo apt update  #Update the system
sudo apt install docker.io -y #Install docker.io service

sudo systemctl start docker   #Start the docker service
sudo systemctl enable docker  #Enable the docker service
sudo systemctl status docker  #Chekc the status of docker service

sudo usermod -aG docker $USER #Give permissions to user over docker
sudo reboot  #Reboot the system to apply the changes
Create a separate directory in your system to store the configurations for Loki and Promtail. This helps keep your code organized and maintains a clean workspace, which is a good practice.
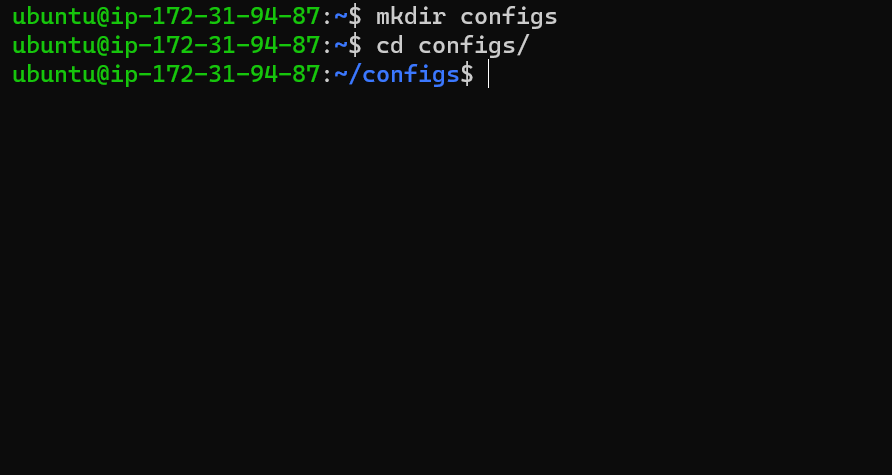
Use the commands provided in the cheatsheet to download the configurations for Loki and Promtail in the current directory.
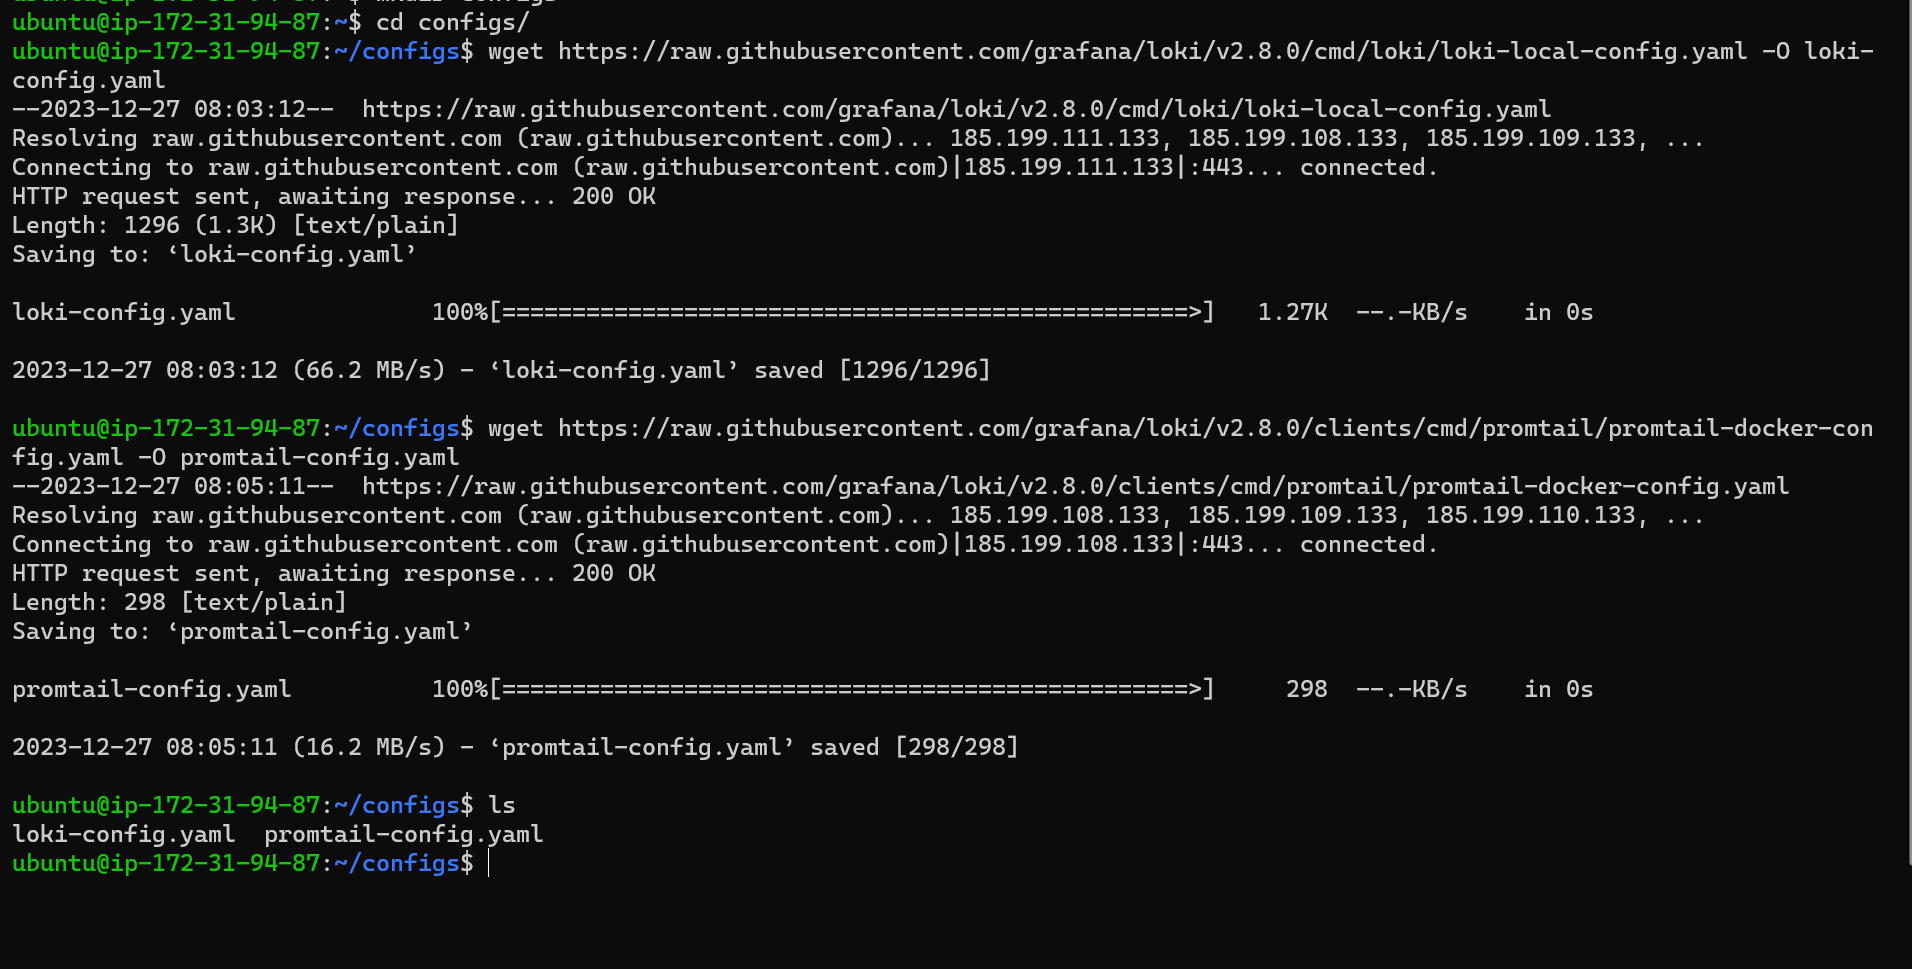
Success! You should see that
loki-config.yamlandpromtail-config.yamlhas been downloaded.Now, all that's left is to run their containers and watch Loki and Promtail in action! Run the required commands from the cheatsheet to execute the Loki and Promtail containers.
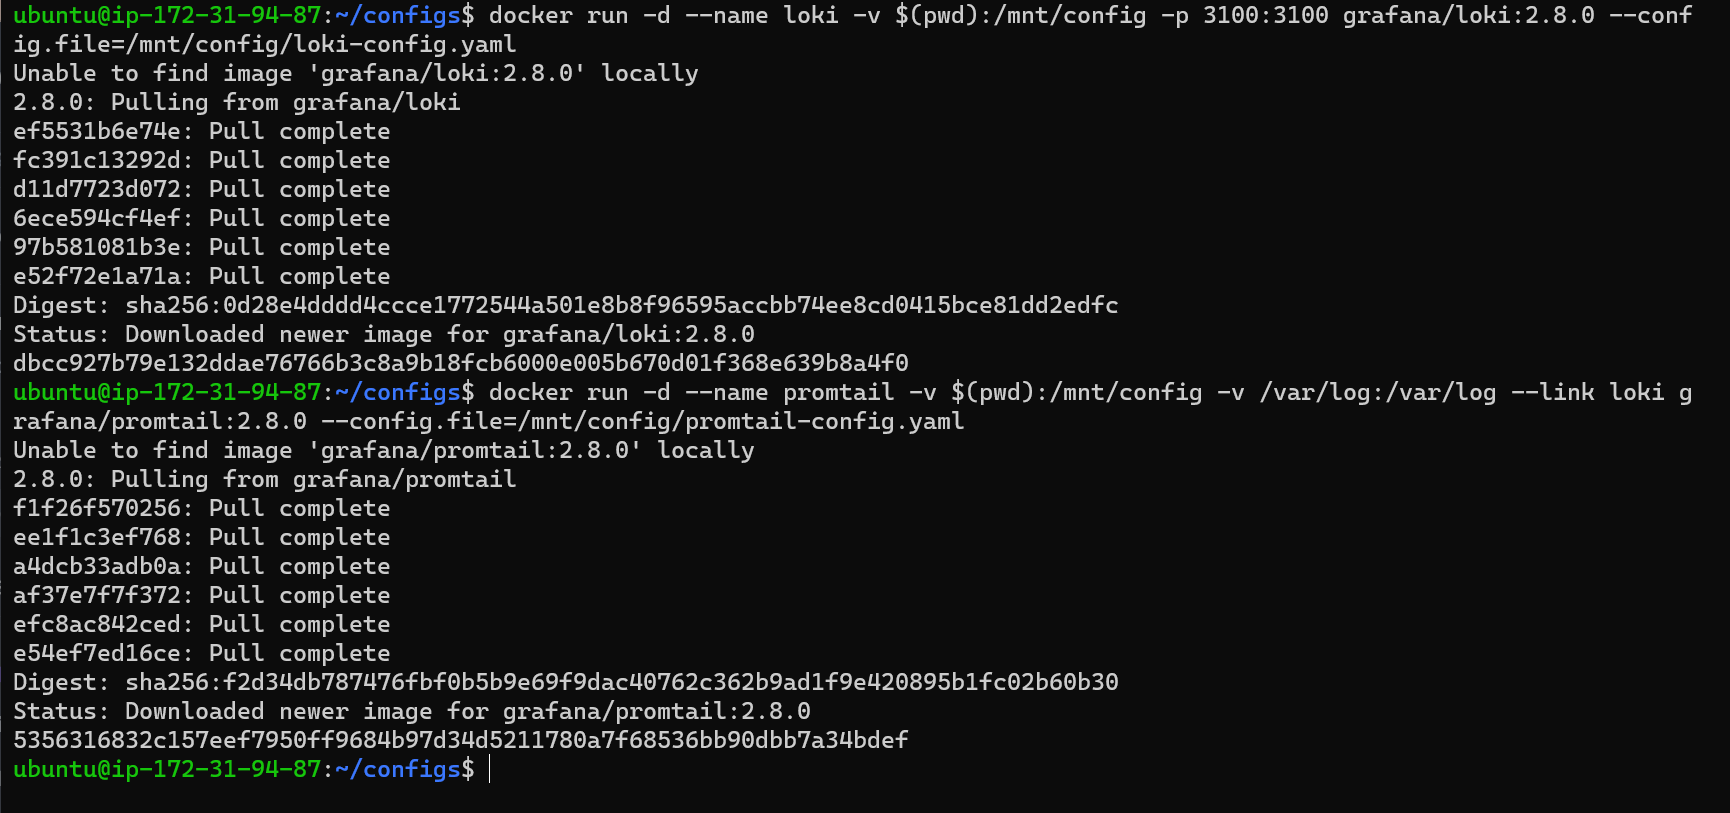
Use the
docker pscommand to check if the containers are running.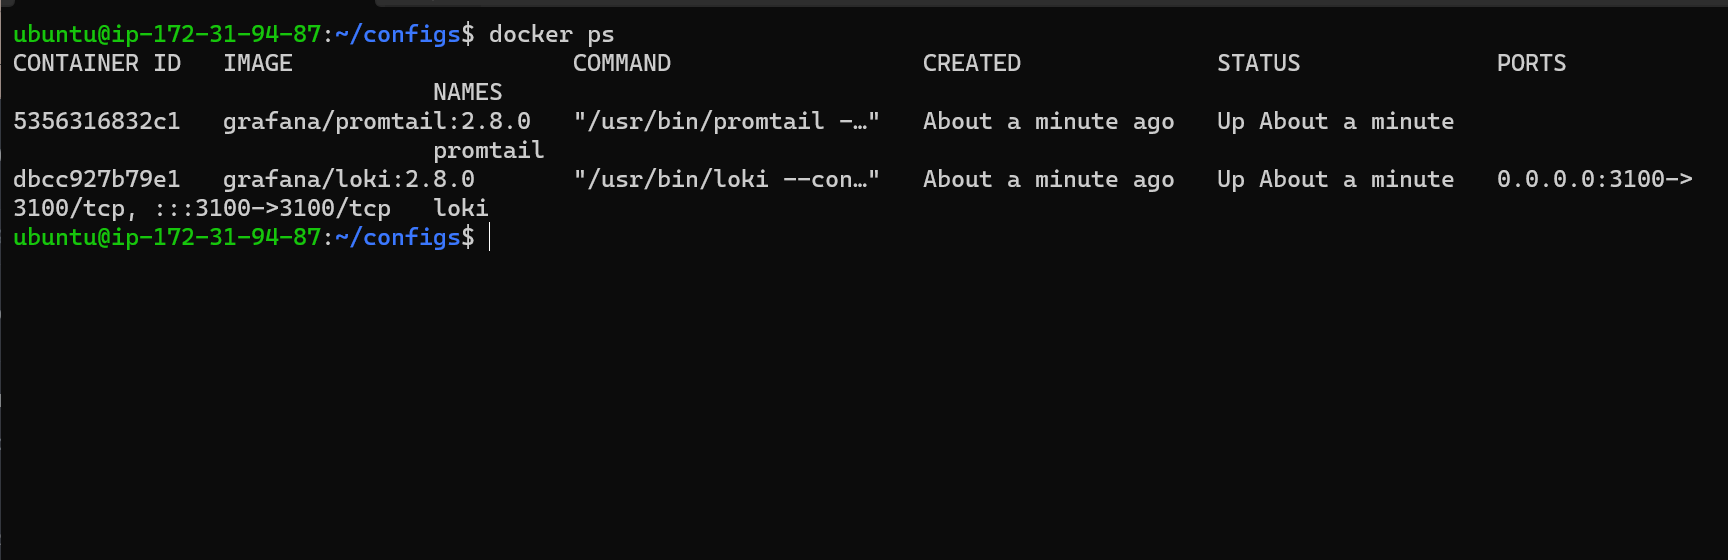
Monitoring System Logs
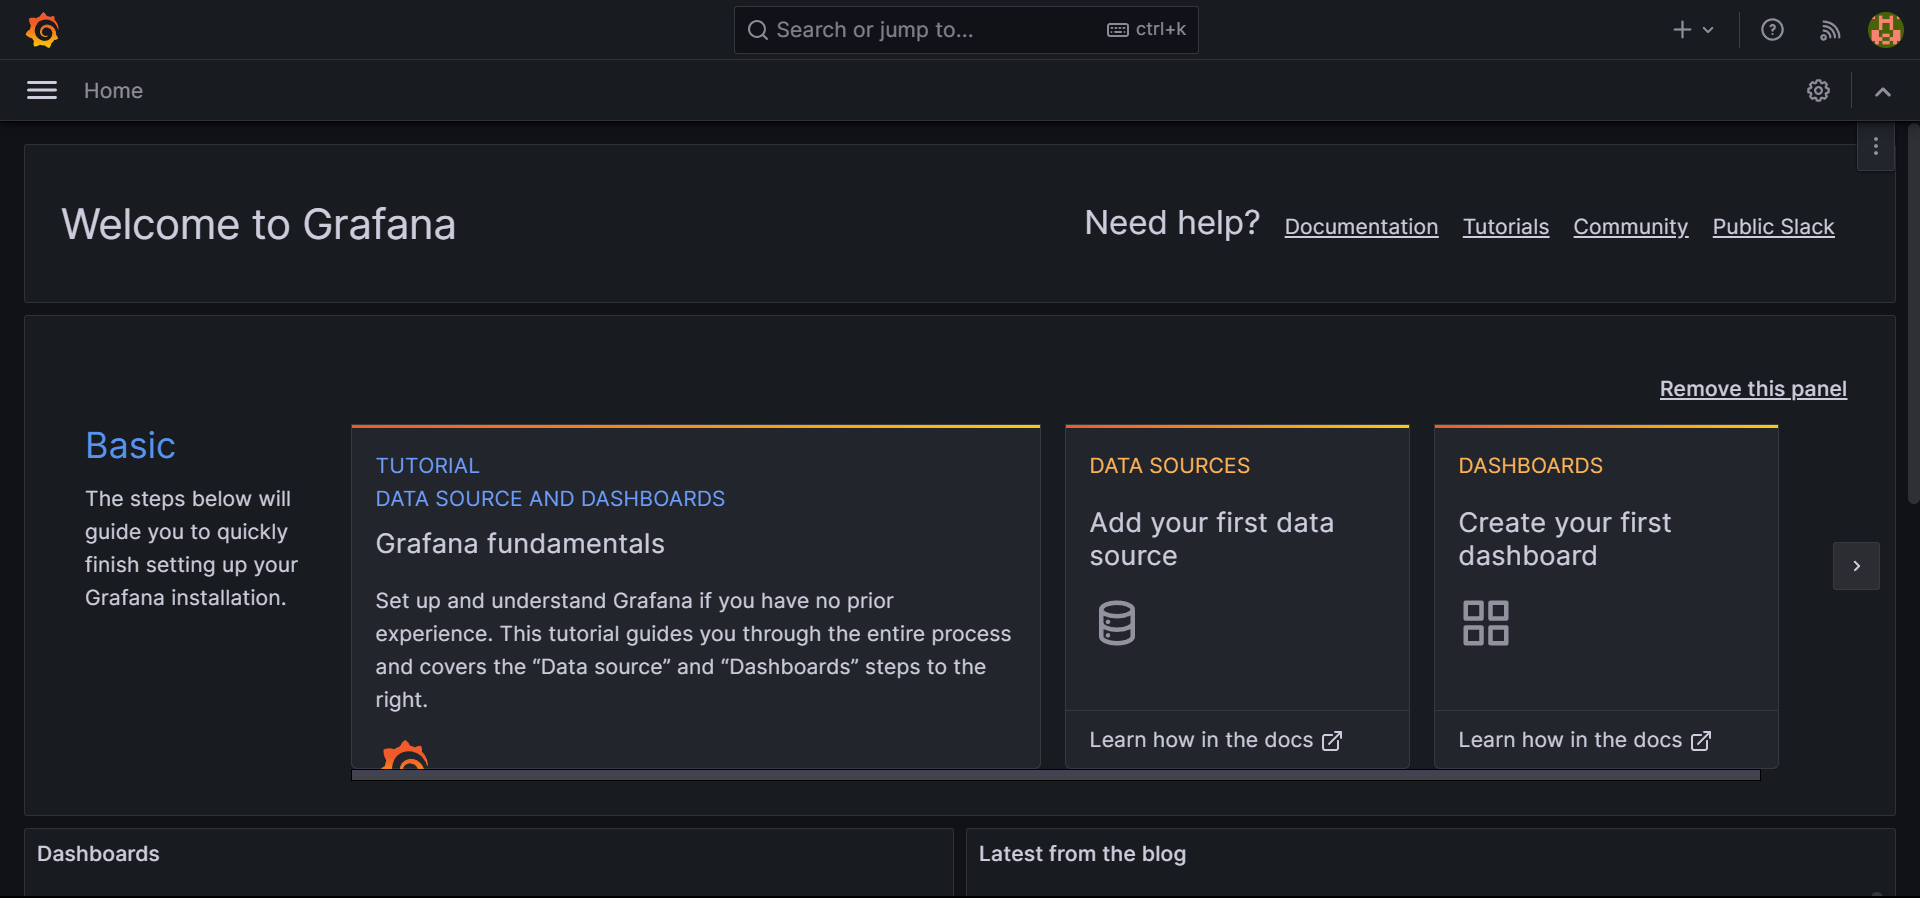
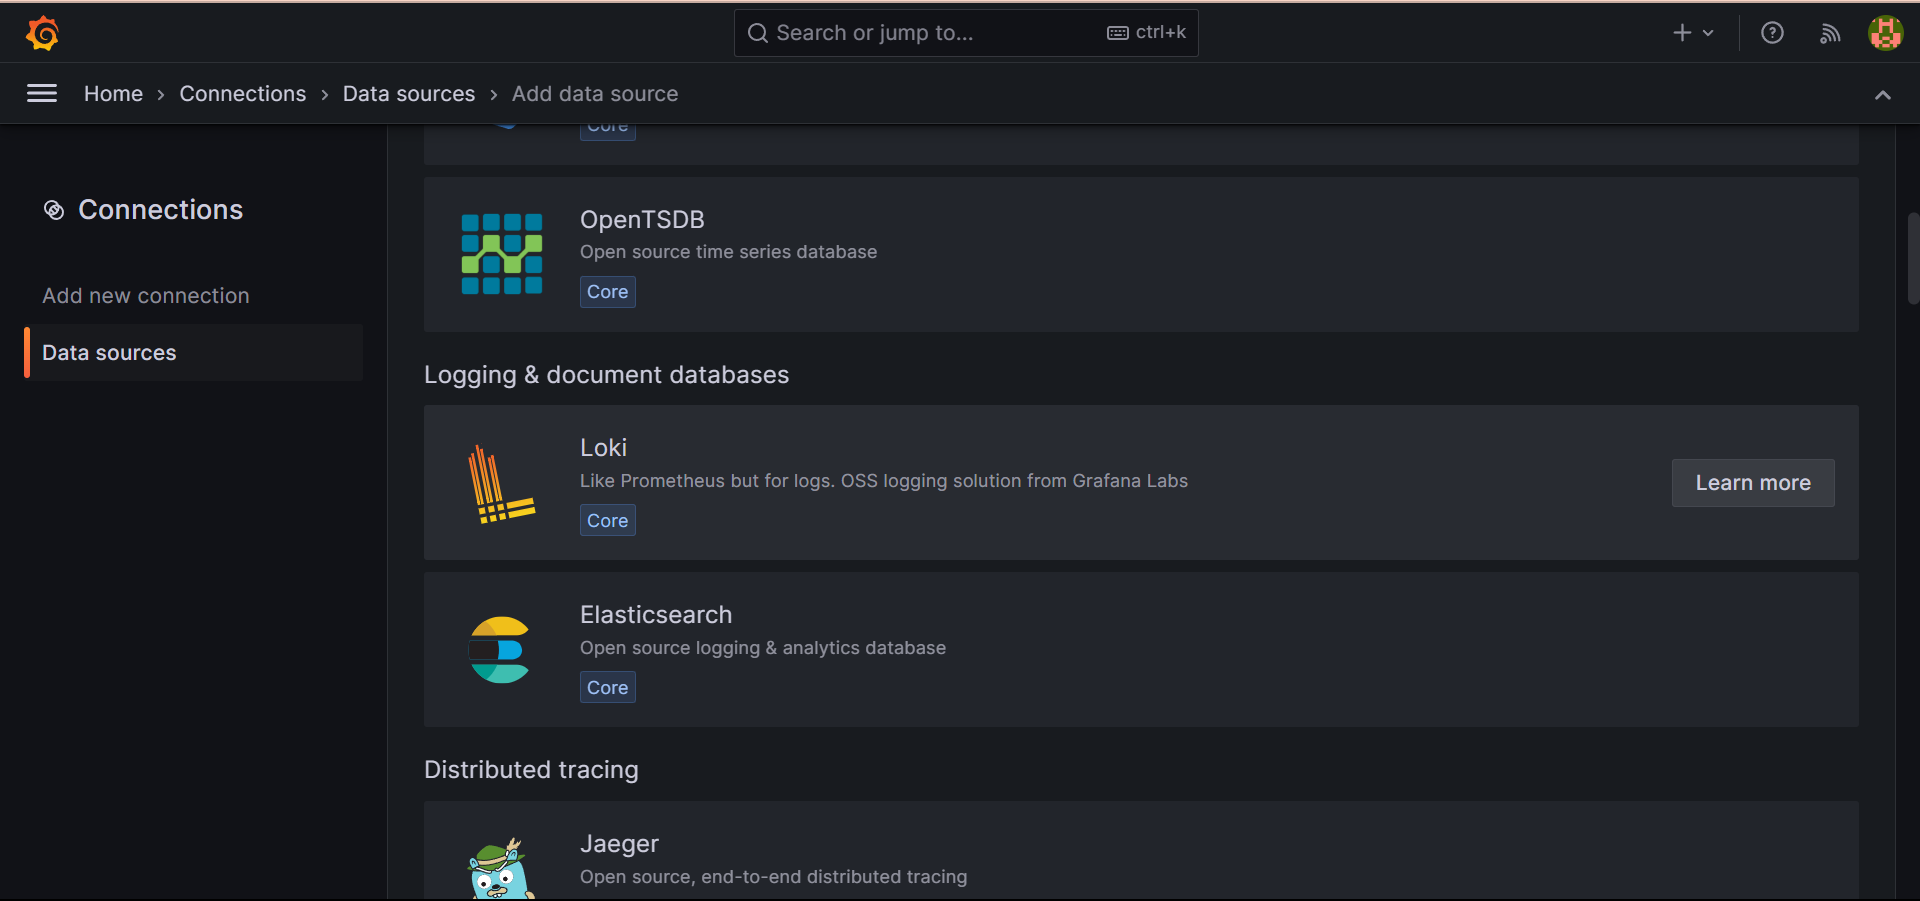
Open Grafana in your browser, head to the data sources section, and choose Loki from the options available.
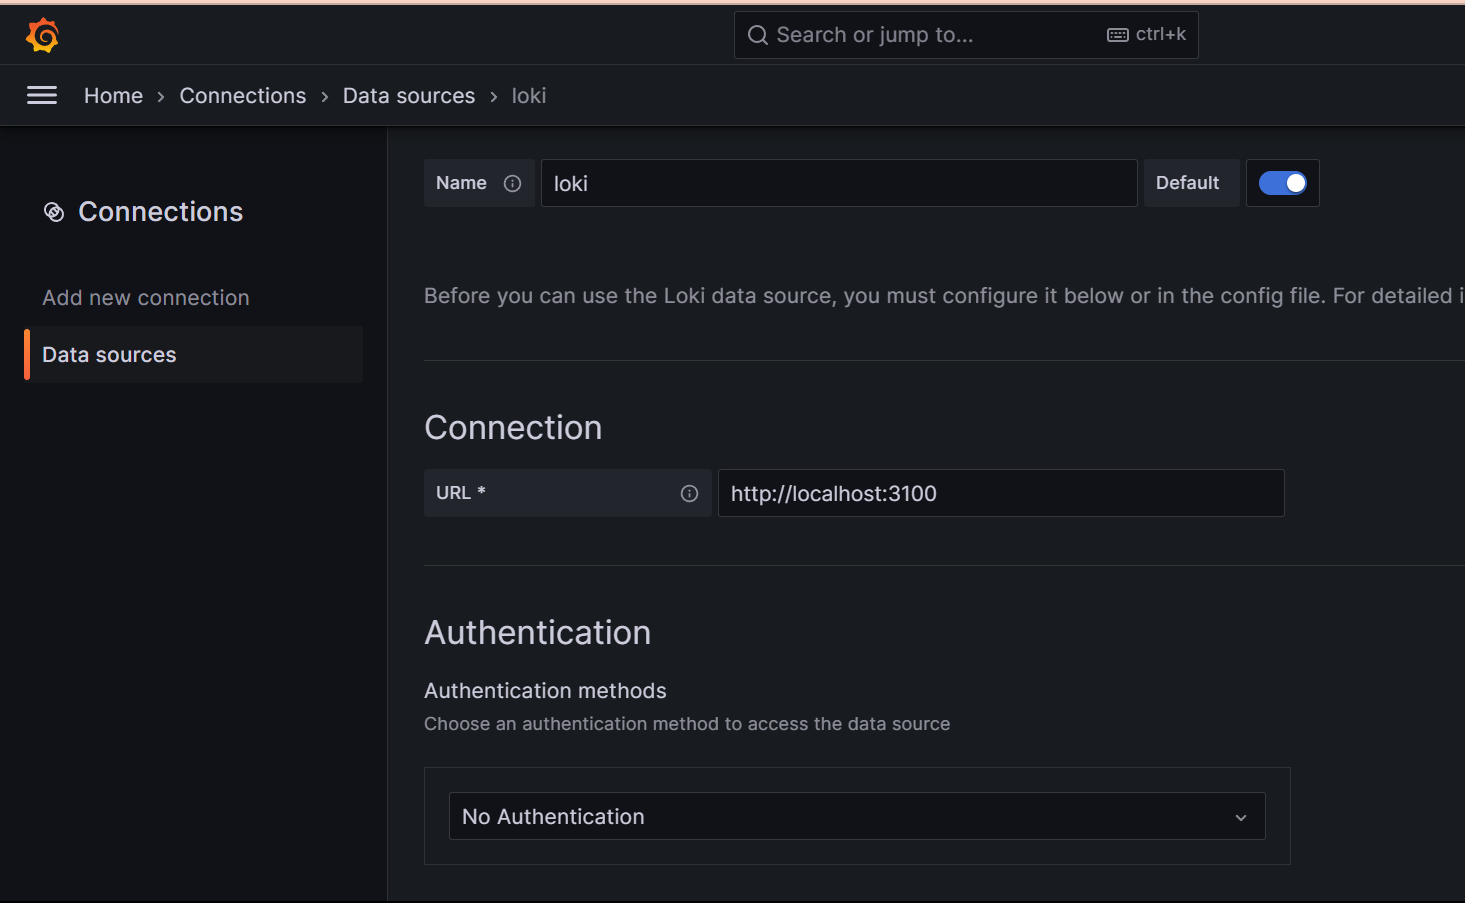
Enter the connection URL as "http://localhost:3100" since Loki is running on port 3100.
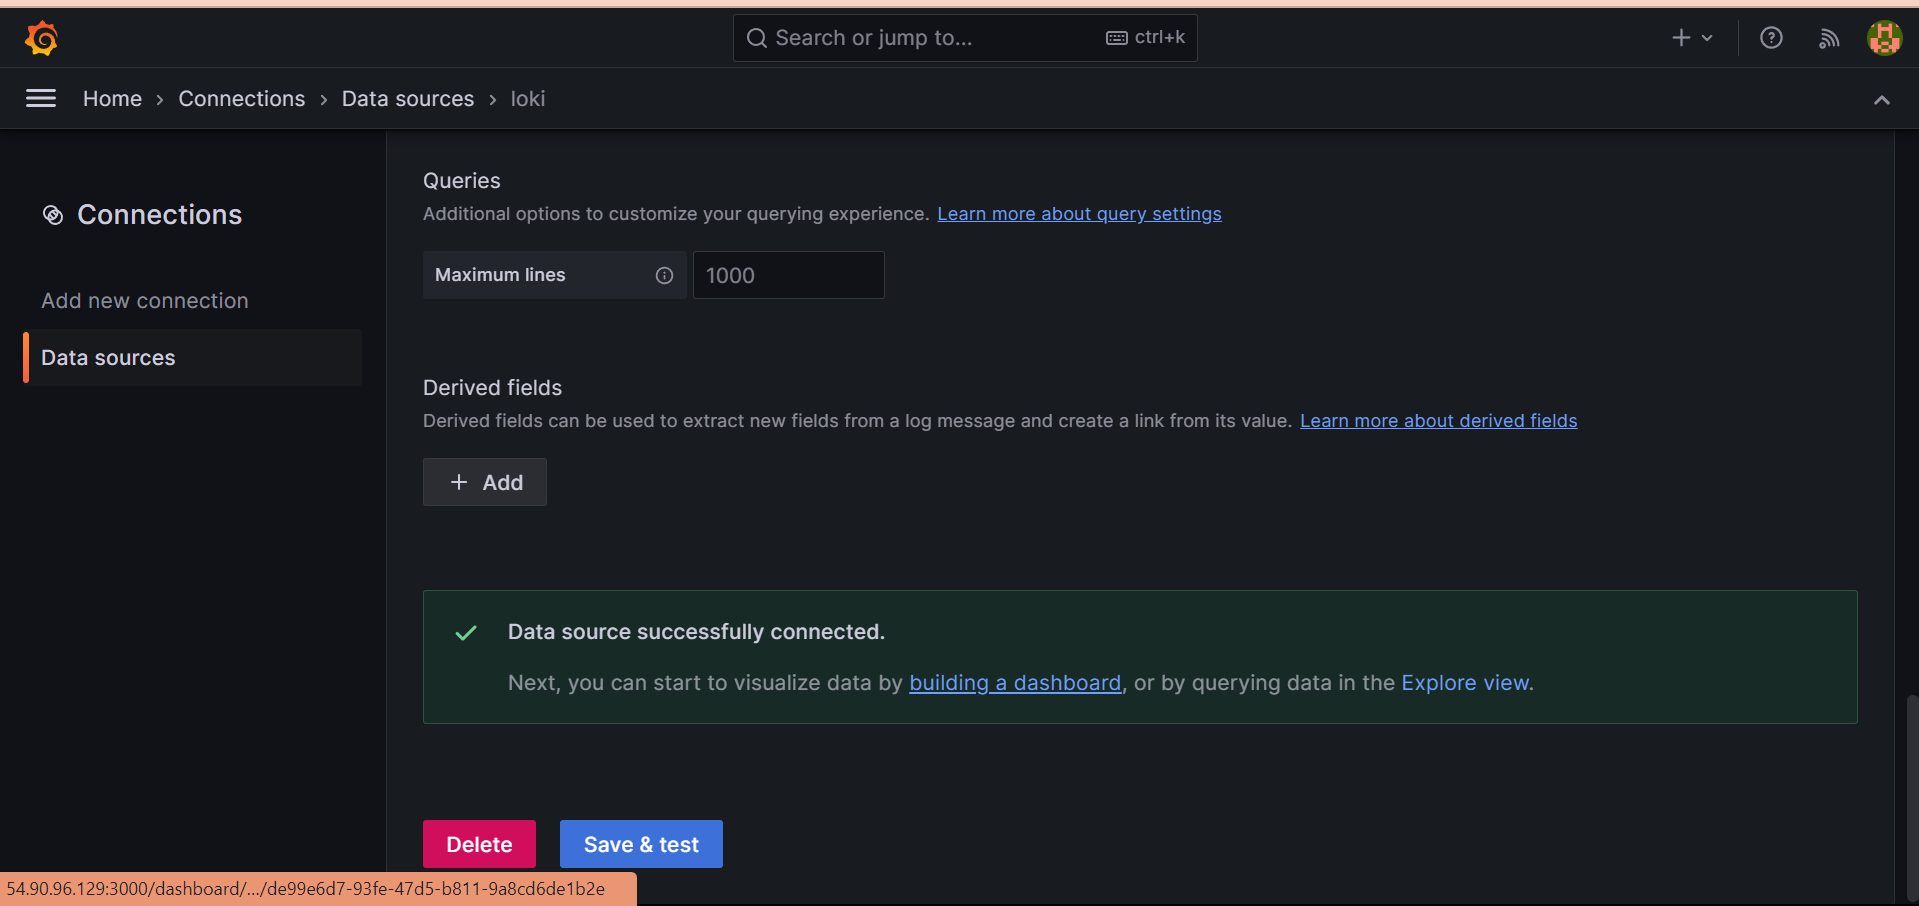
Keep the remaining settings as default, scroll down, and click on the "Save and test" button to verify if Grafana can successfully collect logs from Loki.
If everything is working correctly, the data source will be successfully connected to Grafana.
Next, click on the "Explore view" link. Under the 'Label filters' option, select 'job' and 'varlogs'. Click on "Run query", and you'll see all your system logs displayed on the dashboard.
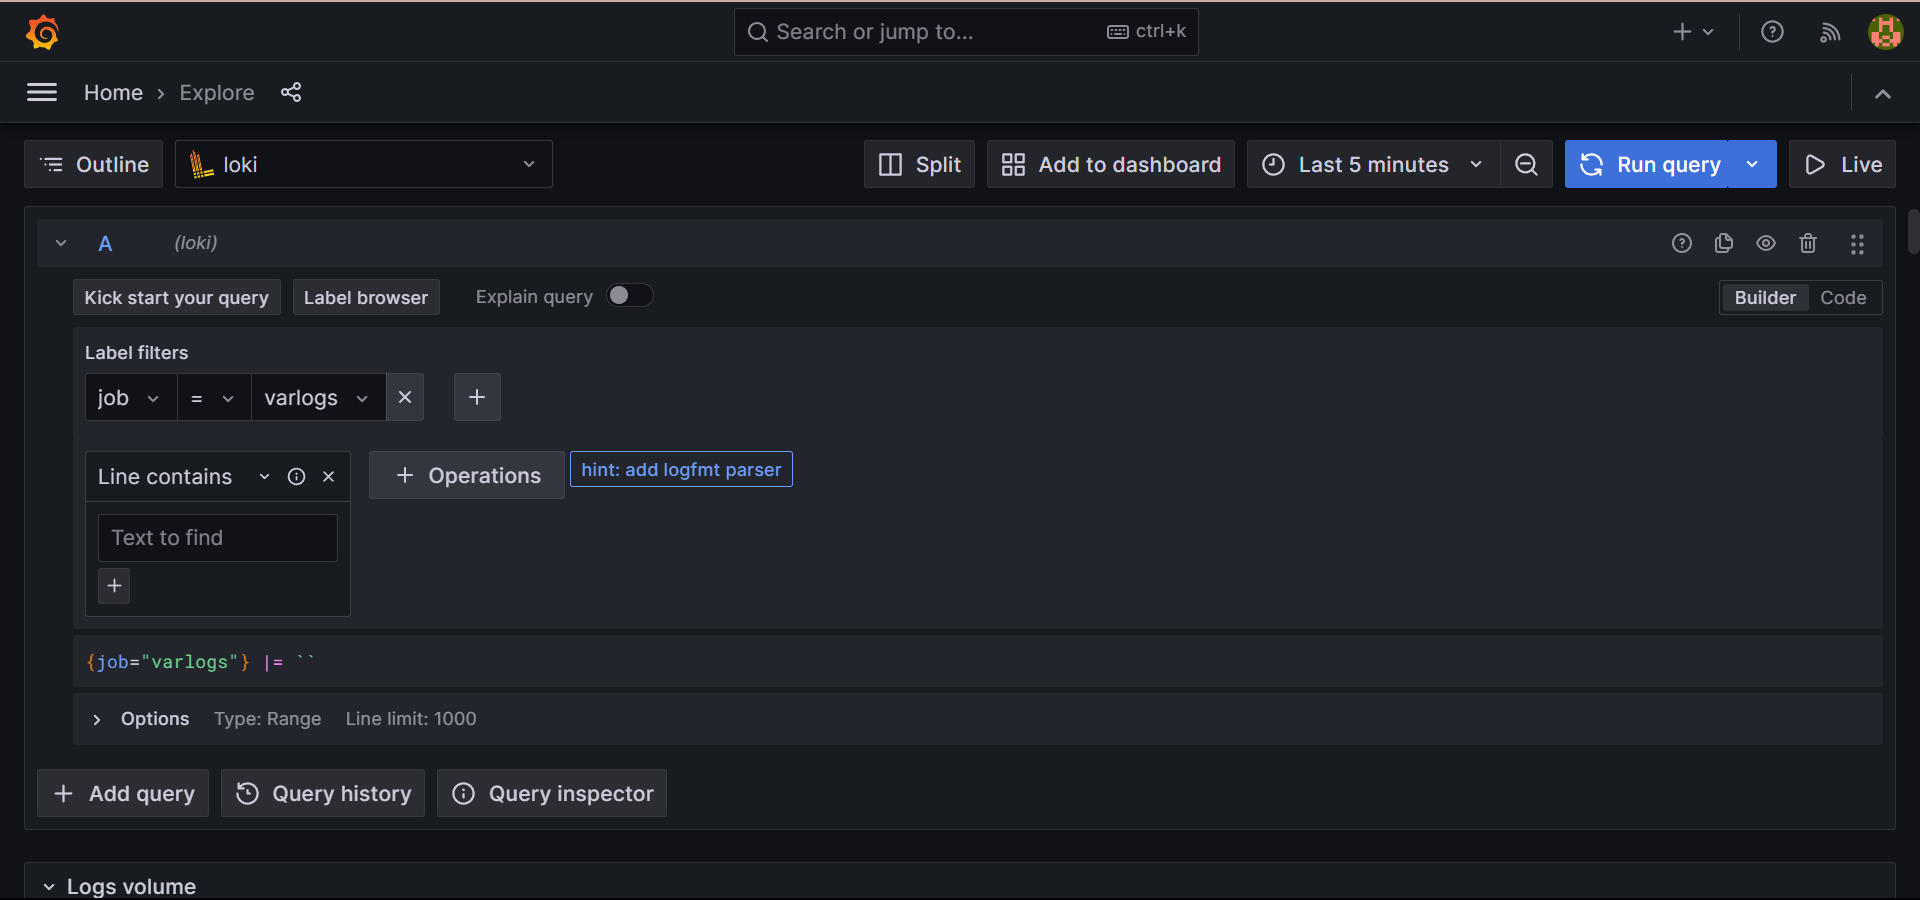
Absolutely! This method allows us to monitor logs on Grafana, utilizing Loki as the data source and Promtail as the data retrieval mechanism. It's a powerful way to observe and analyze logs within Grafana's dashboard interface.
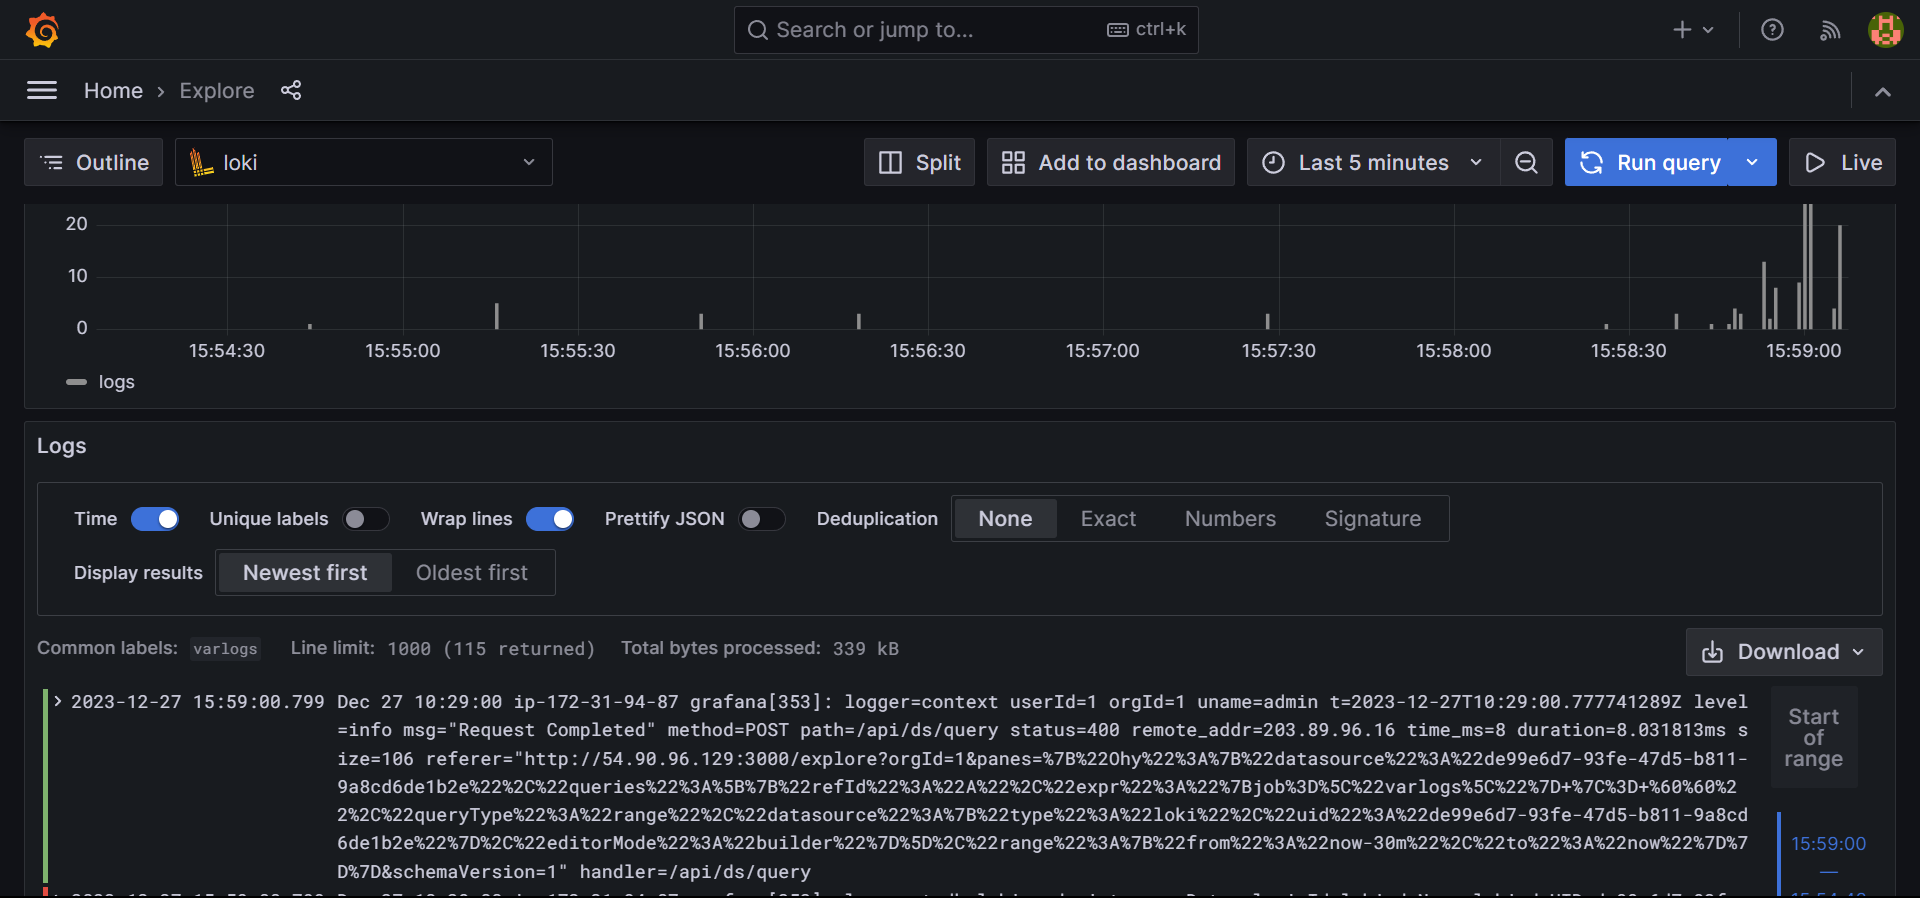
Click 'Add to Dashboard' above to create a new dashboard panel. You can also give this panel a custom name of your choice.
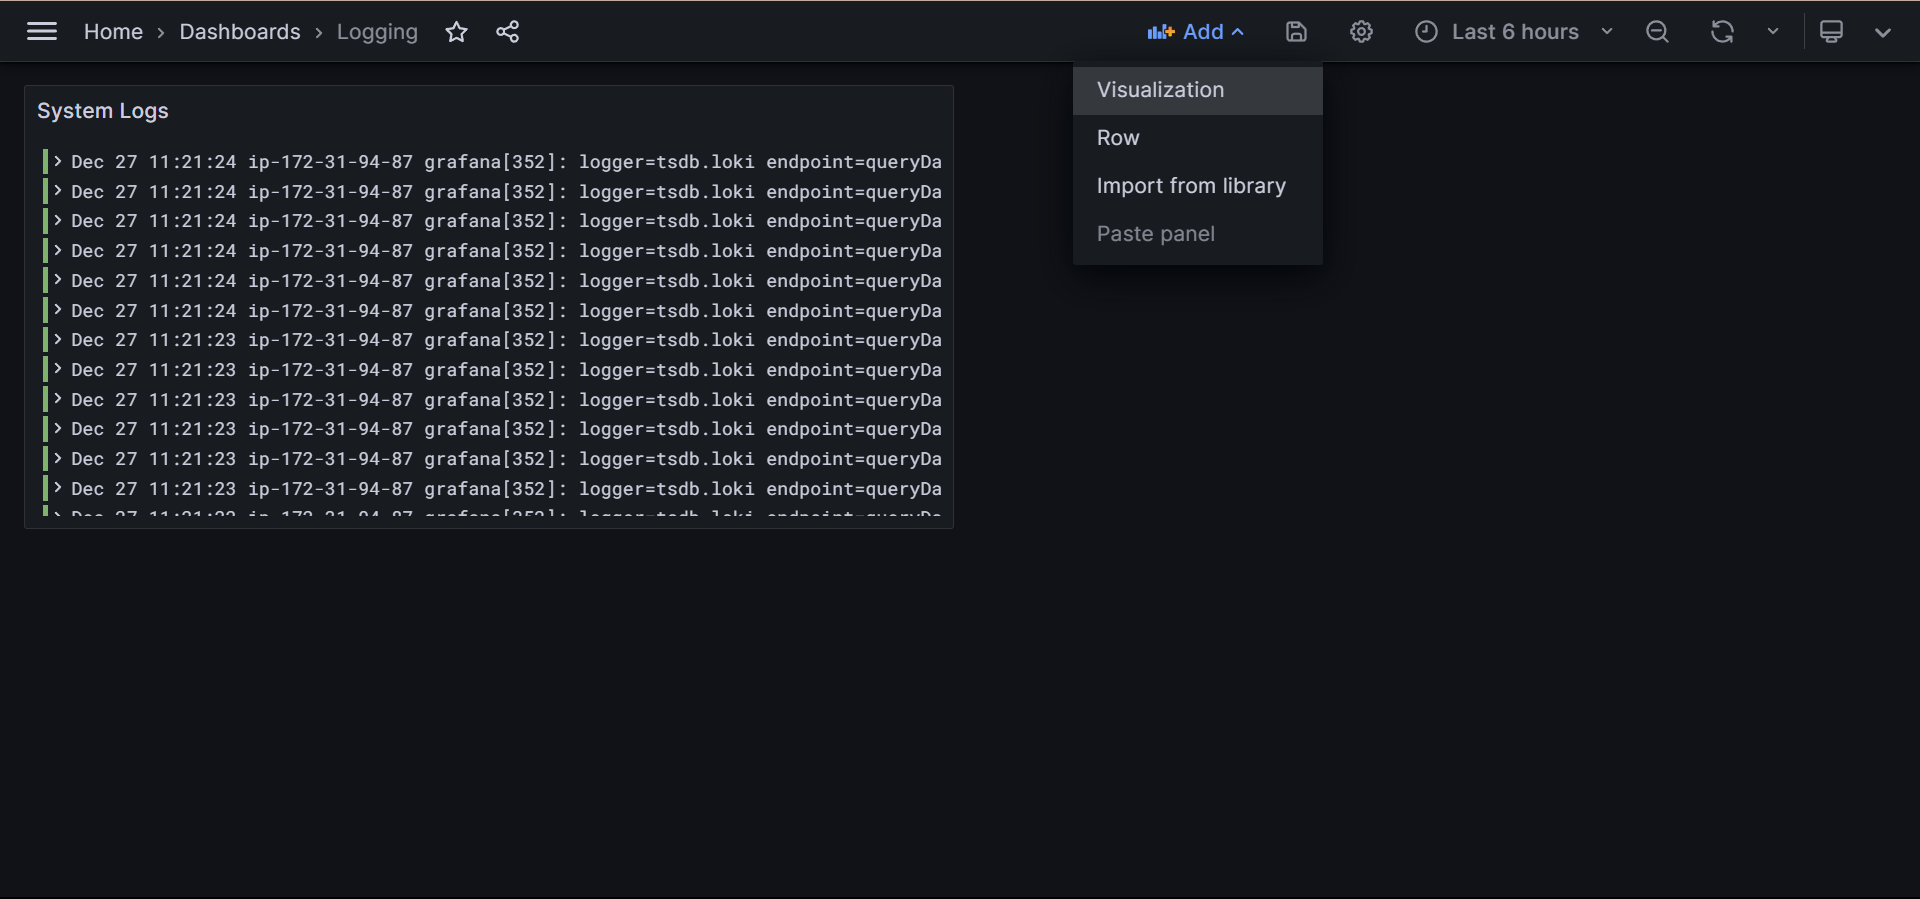
Monitoring Nginx Logs
- You'll need Nginx installed on your server to capture its logs. Copy and execute the commands below in the terminal to install Nginx.
sudo apt update
sudo apt install nginx -y

sudo systemctl enable nginx
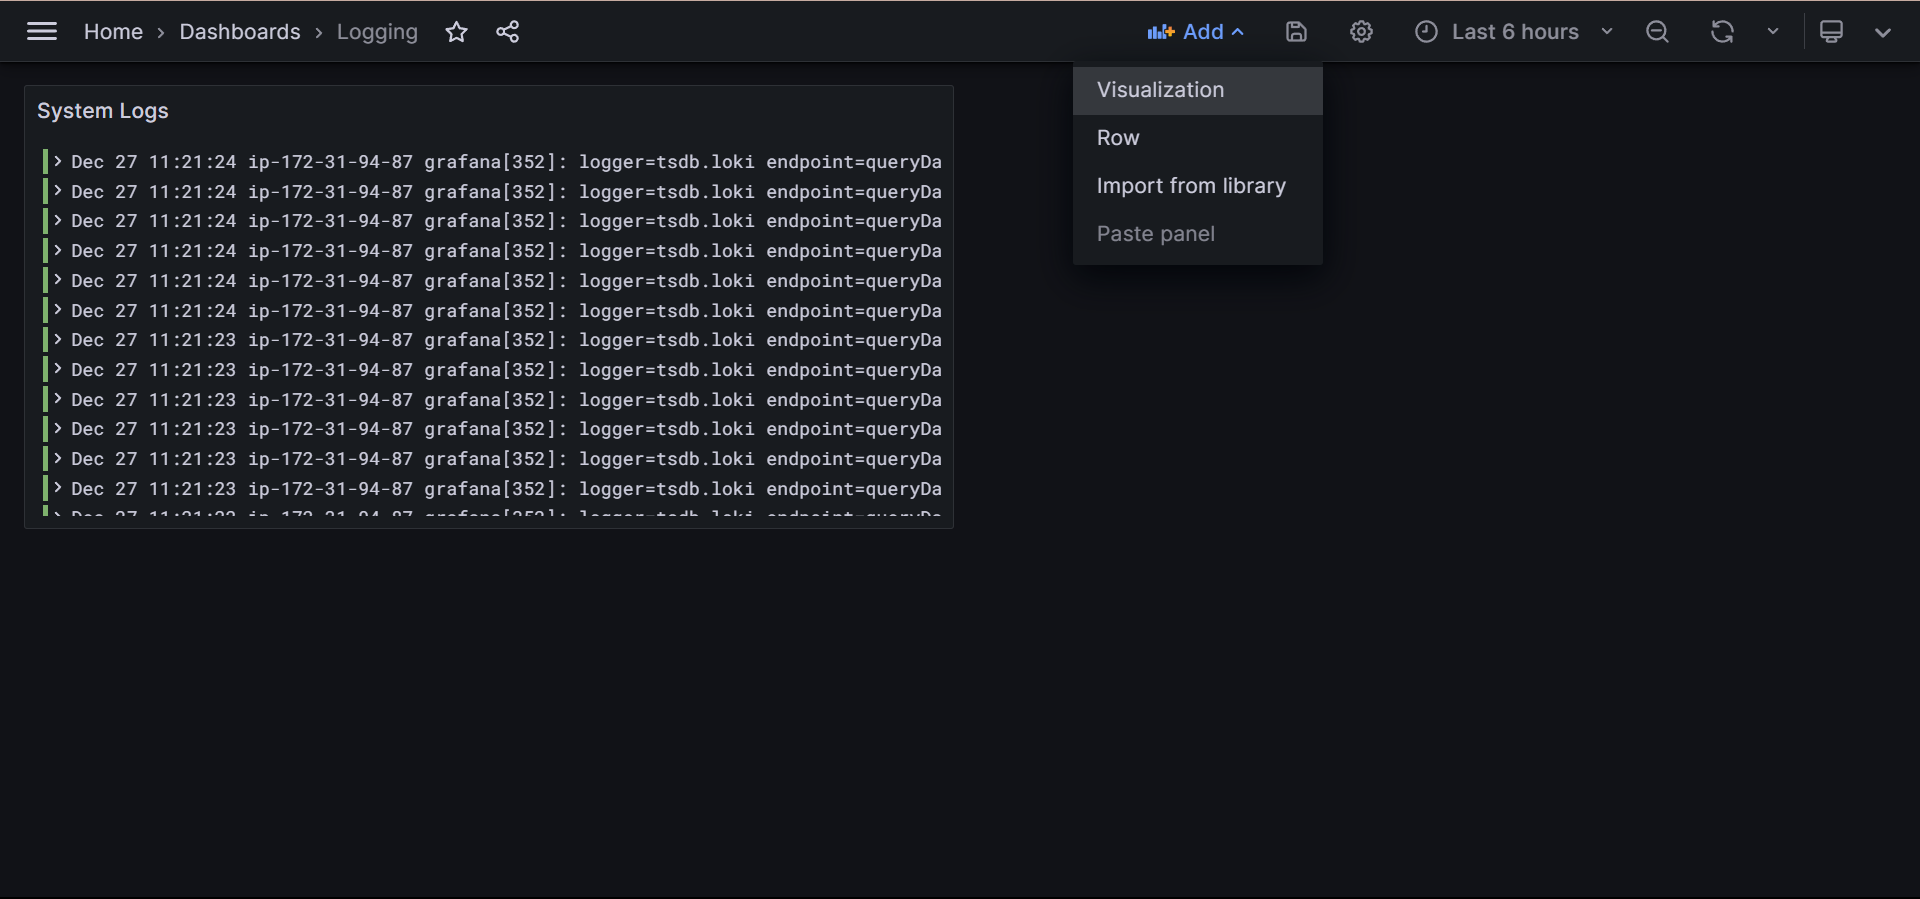
- To capture its logs on the dashboard, let's add a new panel. Click on the 'Add' button at the top of the dashboard. Select 'Visualization' to add new log visuals.
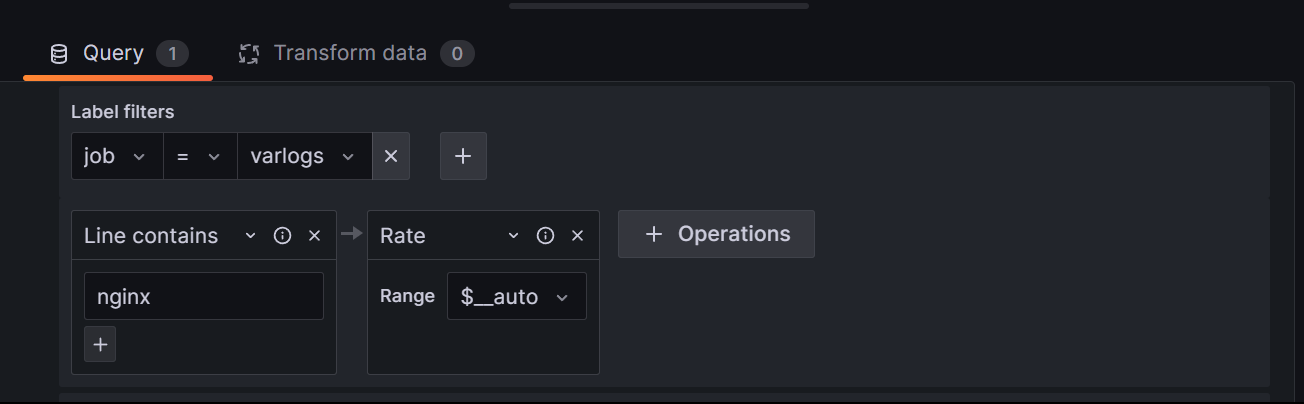
In the panel, once again choose 'job' and 'varlogs' under 'label filters'. Search for nginx-related logs by adding a filter in the 'Line contains' section. Next, select 'Range functions' and 'Rate' from the 'Operations' menu.
Press 'Run query'. In the visualization section, choose 'Gauge' to view the total occurrences of Nginx in the logs. Provide a title for the panel and then save it to the dashboard.
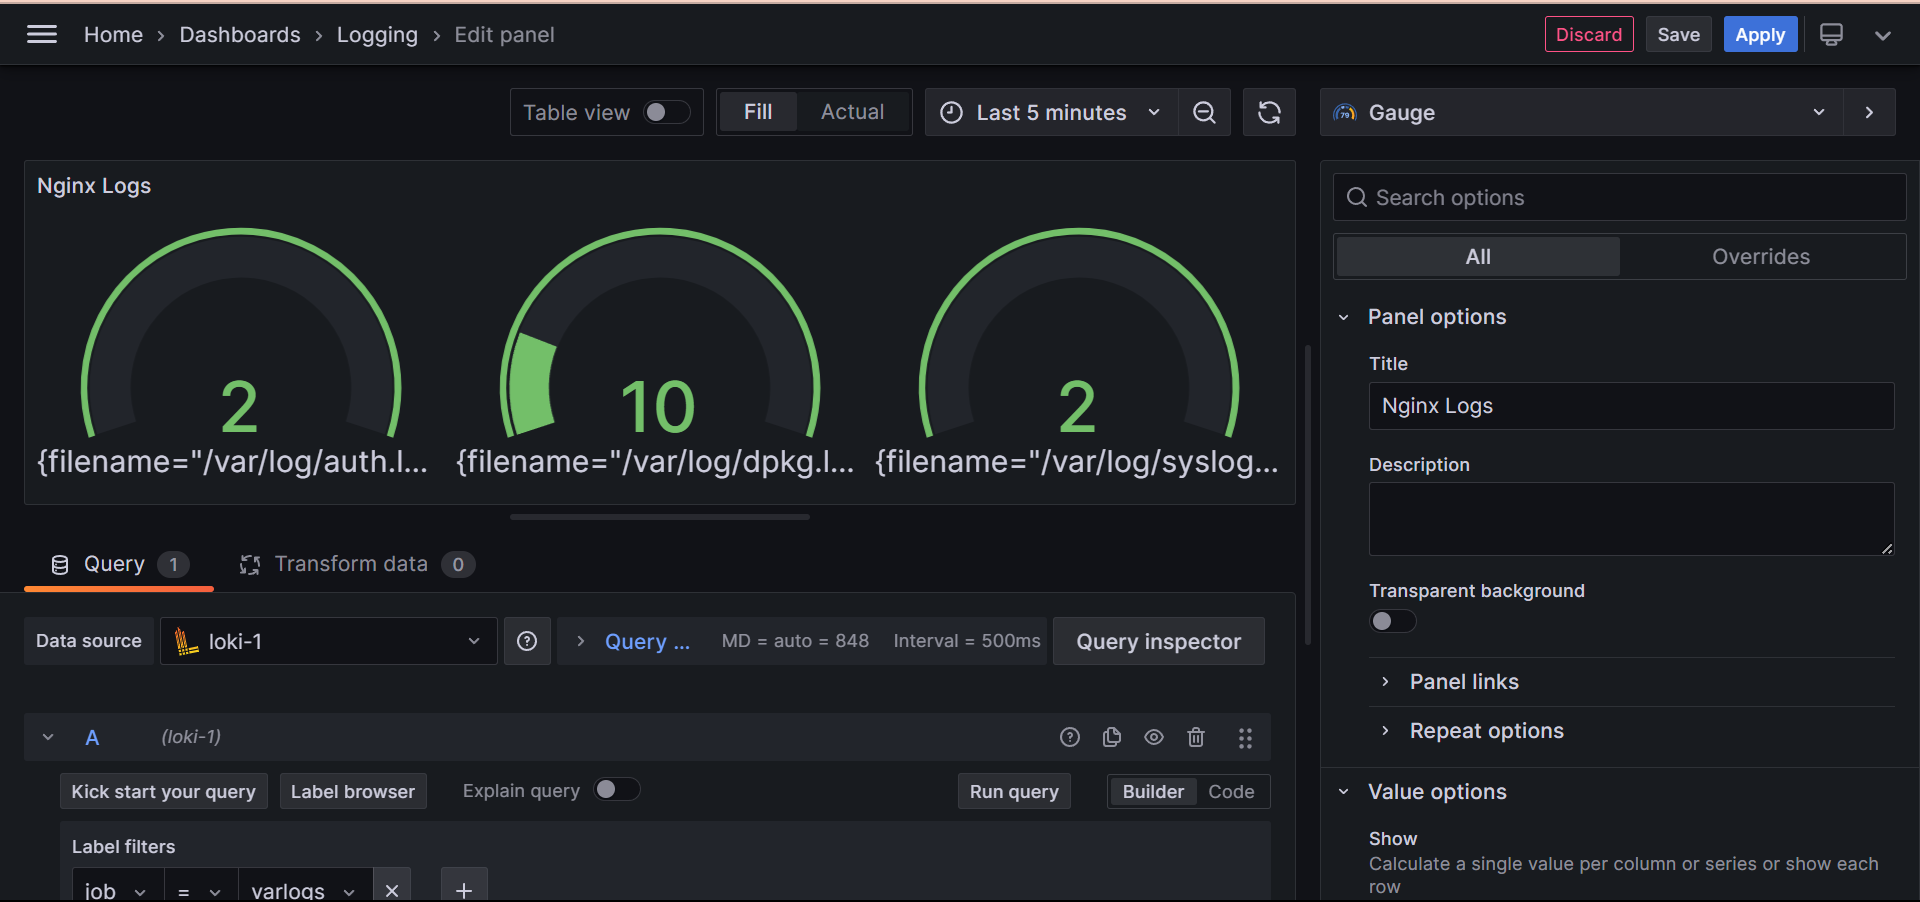
Once saved to the dashboard, it will resemble something like this.
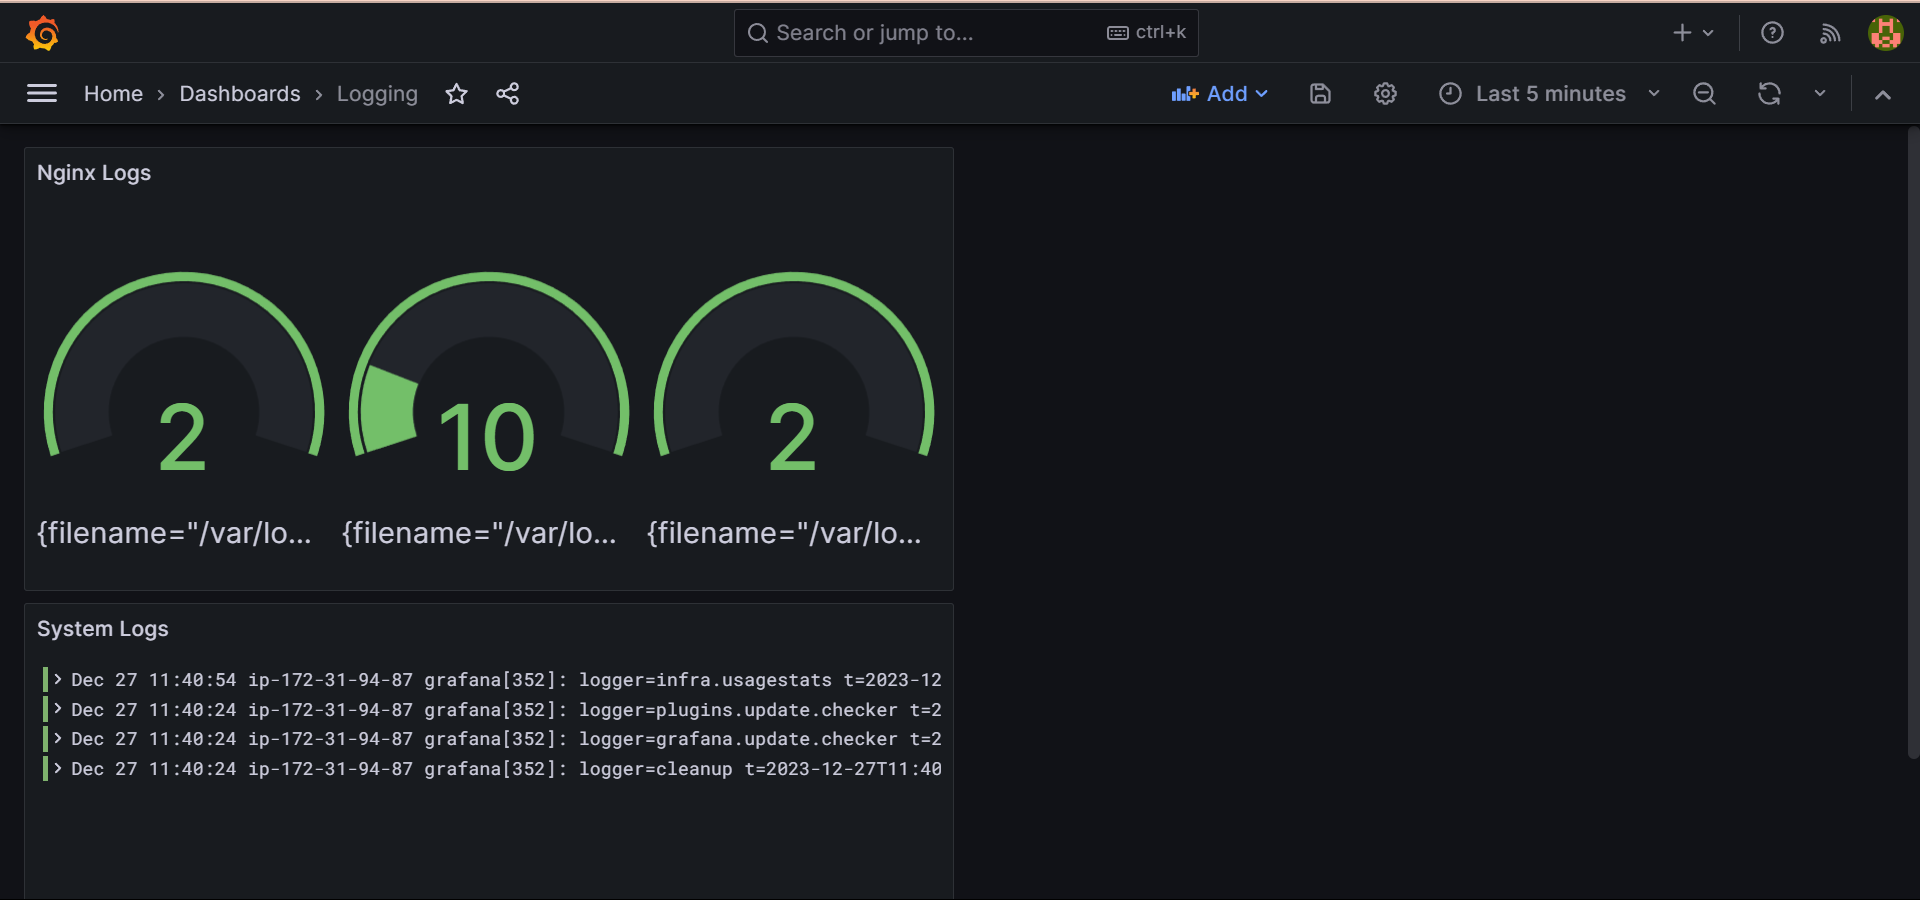
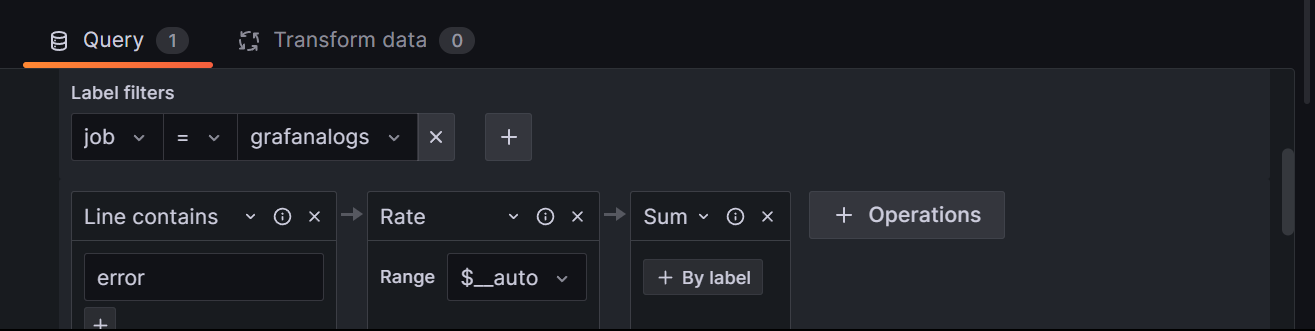
You can add errors by selecting 'job' and 'varlogs' under 'label filters'. Look for 'error' logs using a filter in the 'Line contains' section. Then, choose 'Aggregations' and 'Sum' from the 'Operations' menu.
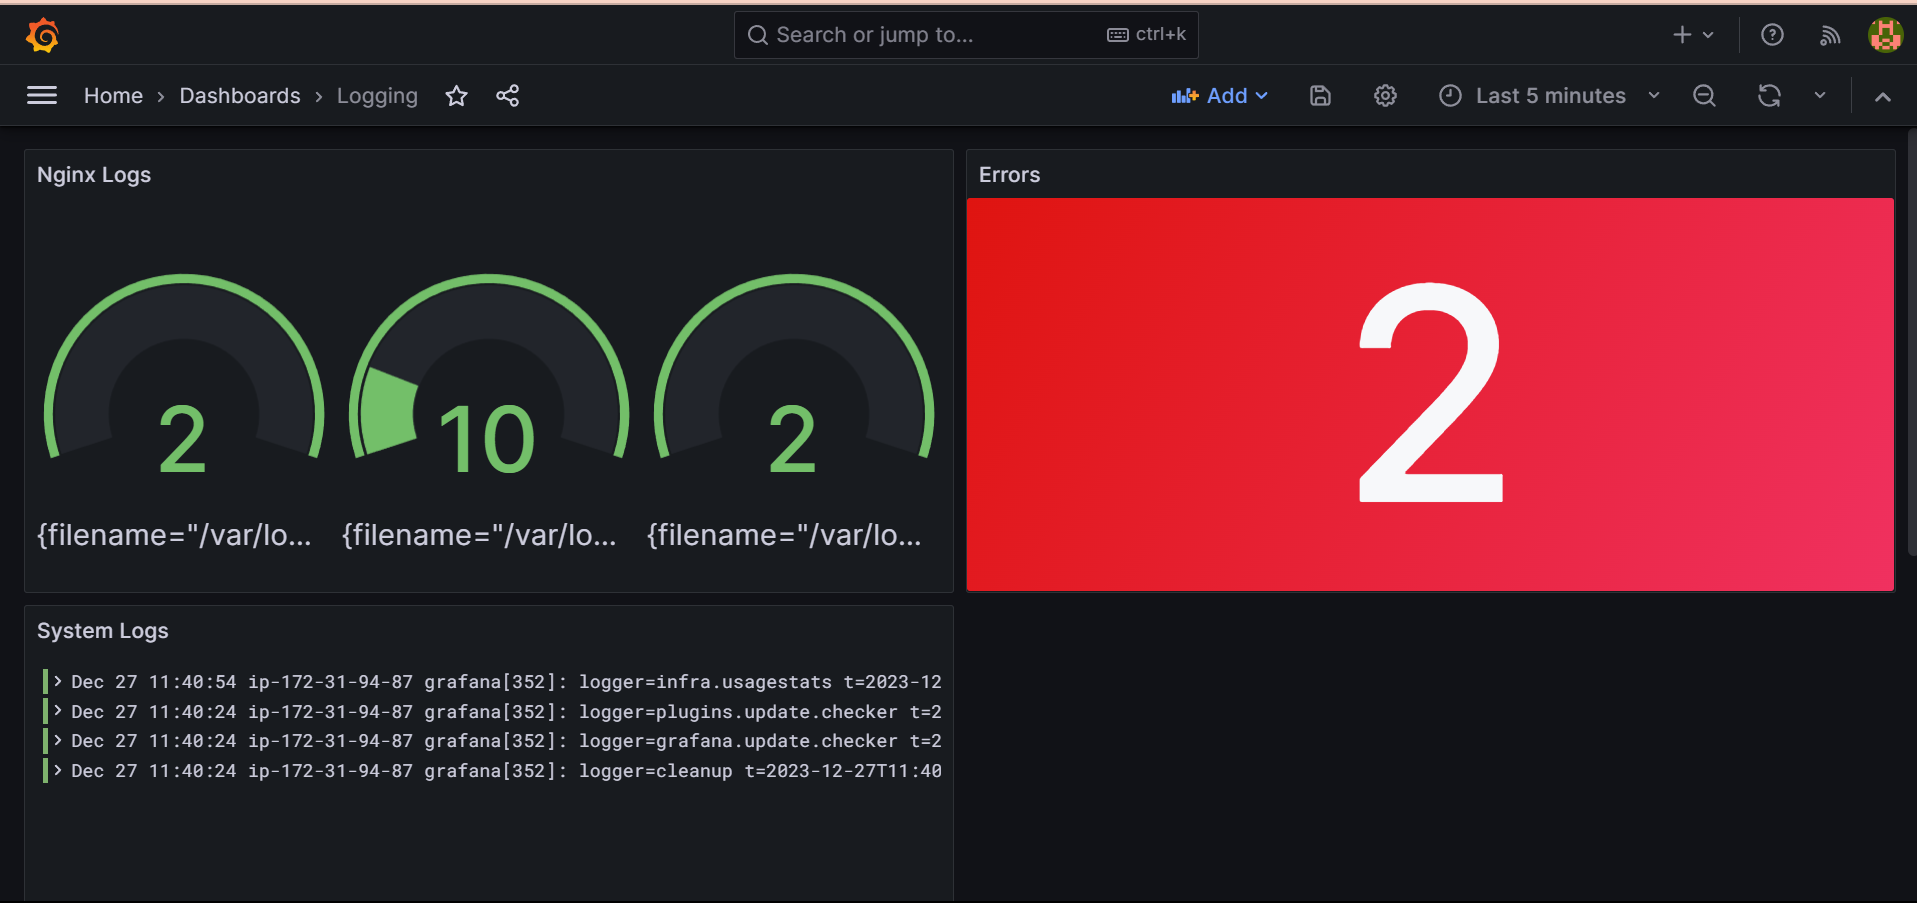
Select any visual you want from visualization you can also change the color and once you select click on save and then apply it to the dashboard.
Monitoring Docker logs
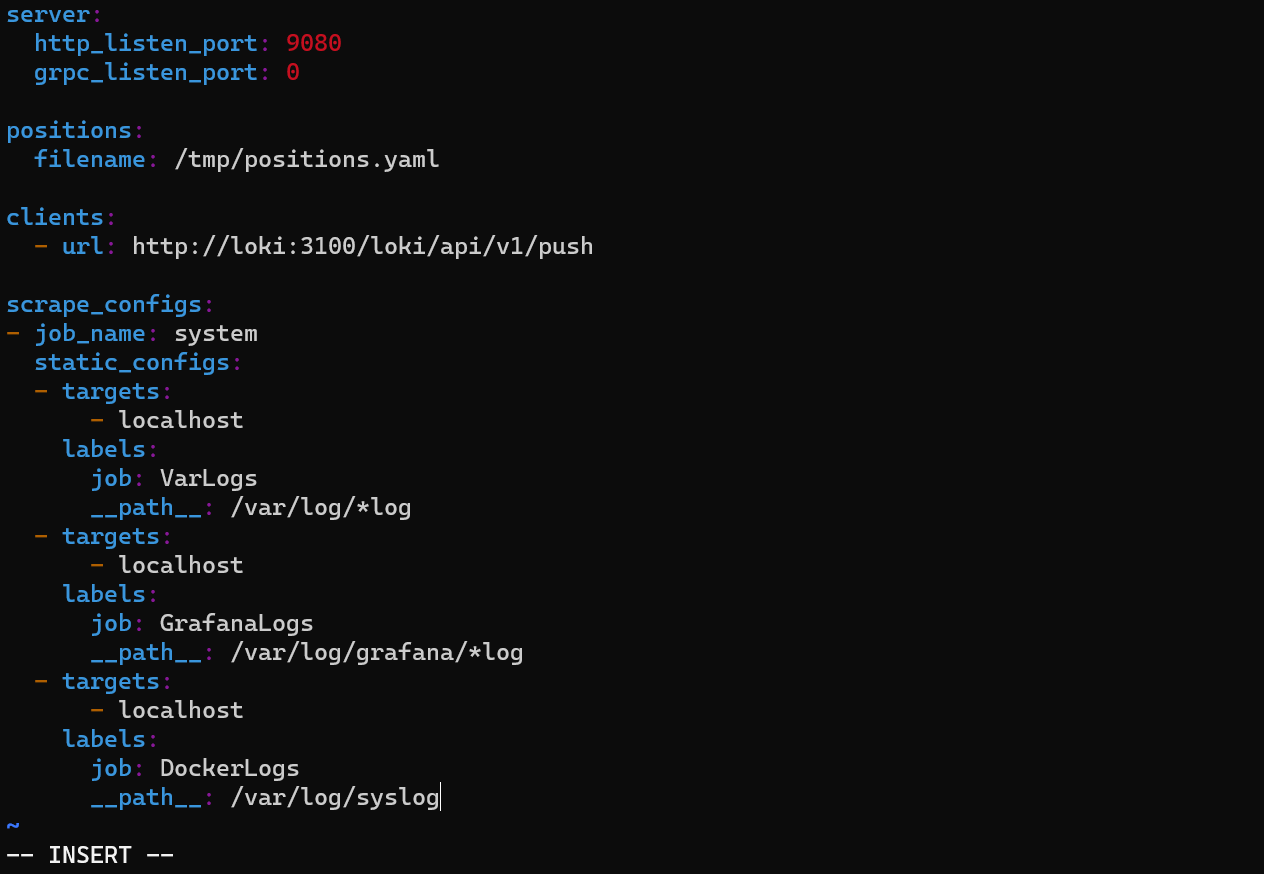
To capture Docker logs, it's crucial to add the path to the Docker log in the Promtail configuration. This step is significant as Promtail collects logs from the specified source in the config file, storing them in Loki. Grafana then utilizes these logs for visualization on the dashboard.
Launch the 'promtail-config.yaml' file using an editor like Vim or nano. Add the Docker log path to the manifest file within the configuration.
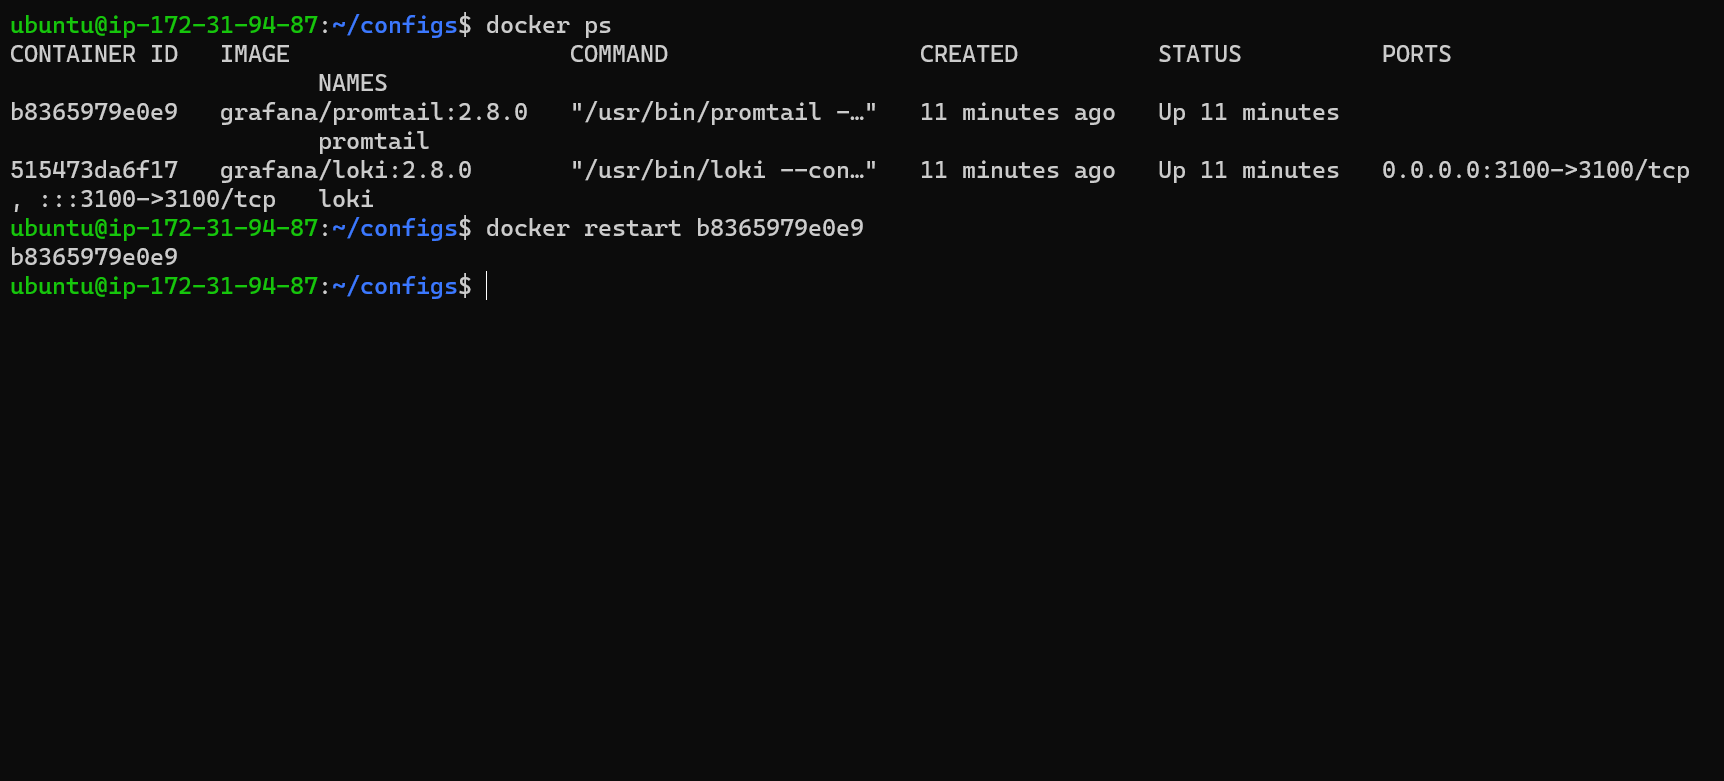
Now, to apply the changes made in the Promtail configuration, restart the Promtail container using the command docker restart <container-id>.
For the rest of the query, follow the familiar process. Select 'job' and 'Dockerlogs' under 'label filters'. Look for Docker-related logs by applying a filter in the 'Line contains' section. In the 'Operations' menu, perform any specific operations on the logs if needed.
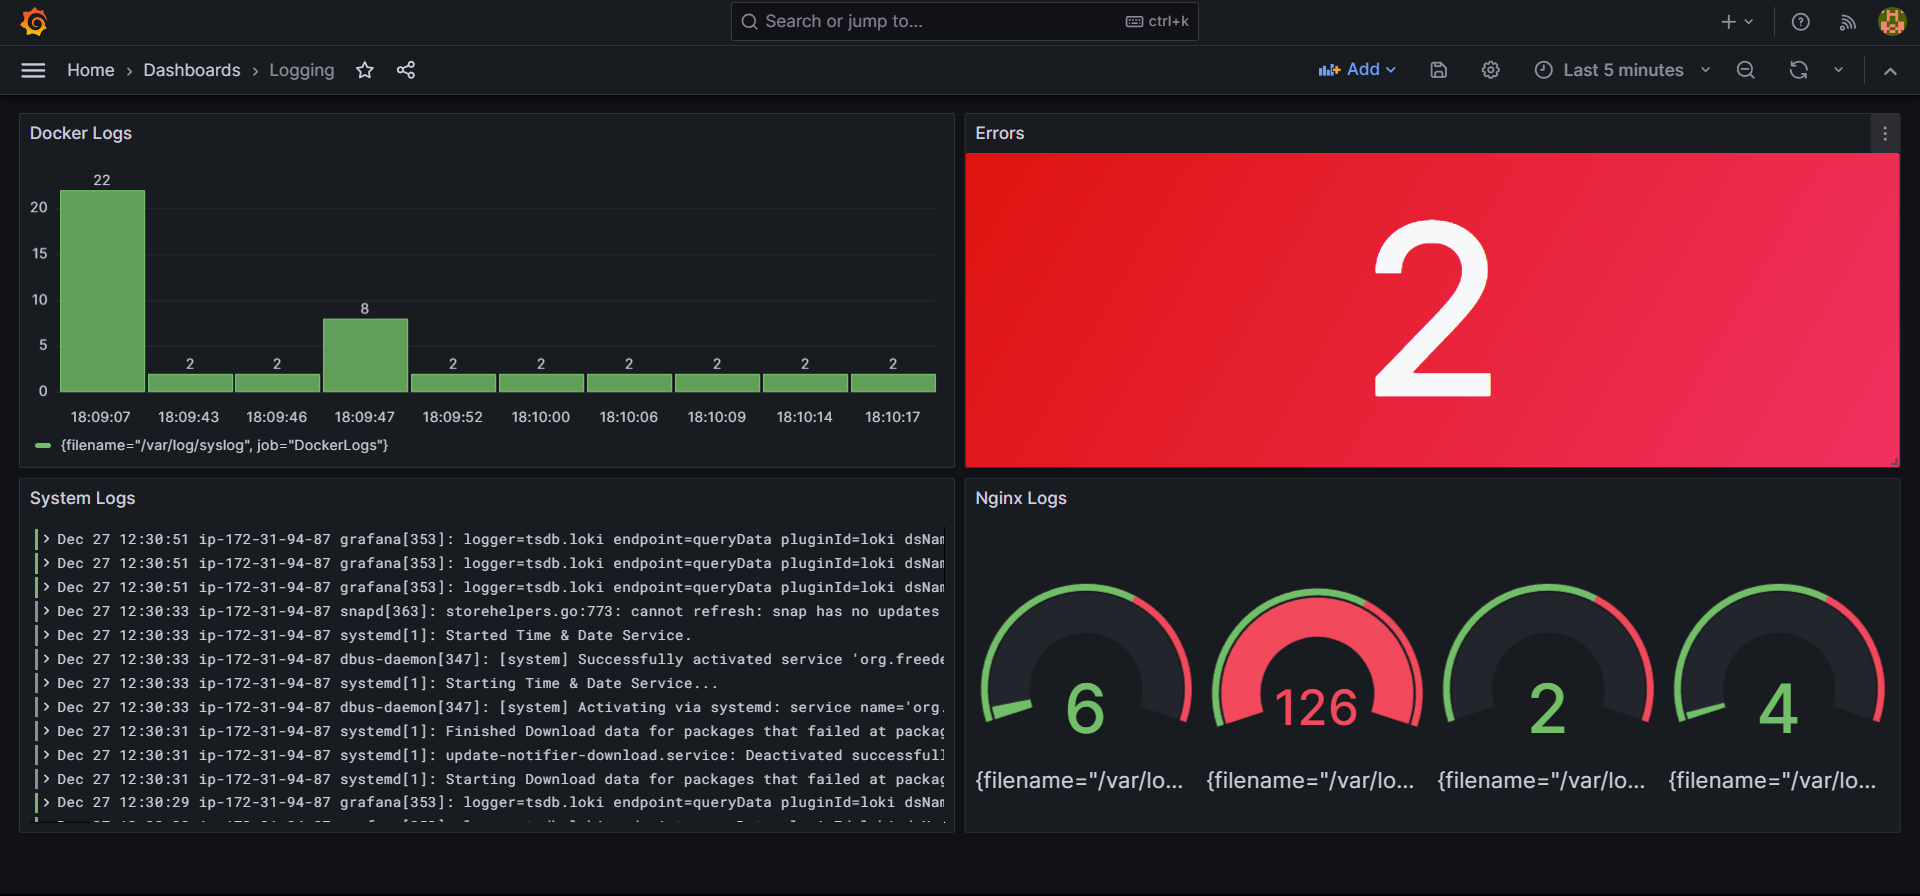
Here's the final representation of our dashboard, which might resemble something like this.
Conclusion
Absolutely! Grafana is an incredibly user-friendly tool that allows us to effortlessly craft visually appealing and impactful dashboards for various needs. Loki and Promtail play a crucial role by capturing, storing, and providing logs to Grafana, enabling comprehensive visualization and analysis.

If you still have questions, check out this awesome tutorial to get all your doubts cleared.